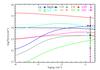
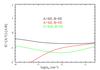
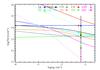
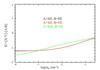
Fig. B.1
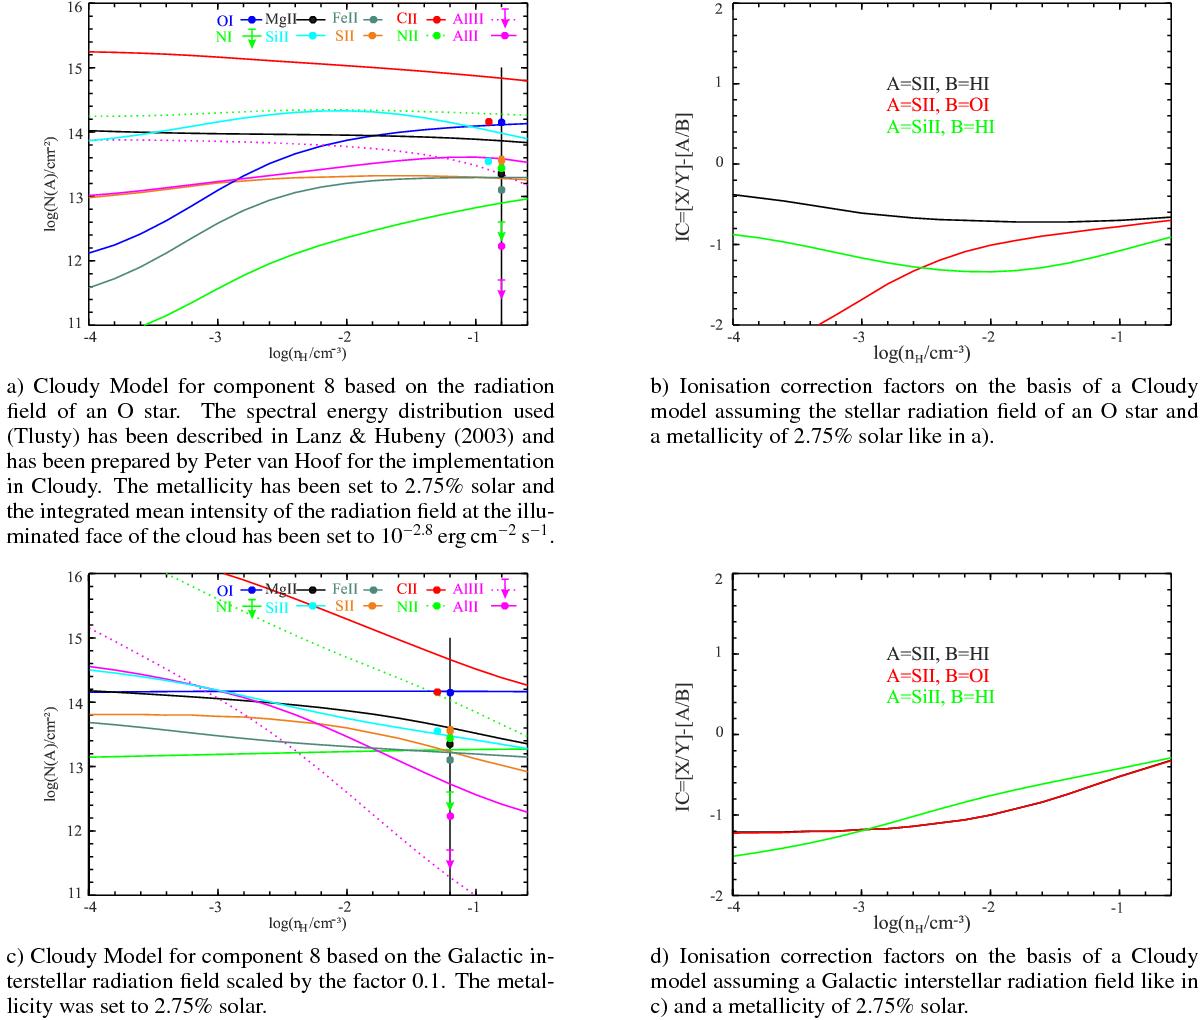
(a, c) Cloudy test models for component 8 in the absorption line system at z = 1.839. The lines represent the Cloudy predictions and the symbols the measured values. The correlation between the symbols and the lines is shown in the legends in the upper right corners. Circles correspond to measured values with the error bars being smaller than the symbol itself except for sulphur. For Al iii and N i upper limits are given. The vertical black lines indicate the hydrogen density of our favourite models. The symbols sometimes have an offset for clarity. (b, d) Ionisation correction factors derived by Cloudy based on models a) and c), respectively. It is evident that the correction factors are significant, but these (unrealistic) test models, that have been set up to explore the Cloudy parameter range, cannot reproduce the observed abundance pattern, as expected.
Current usage metrics show cumulative count of Article Views (full-text article views including HTML views, PDF and ePub downloads, according to the available data) and Abstracts Views on Vision4Press platform.
Data correspond to usage on the plateform after 2015. The current usage metrics is available 48-96 hours after online publication and is updated daily on week days.
Initial download of the metrics may take a while.