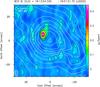
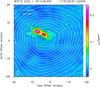
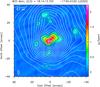
Fig. 6
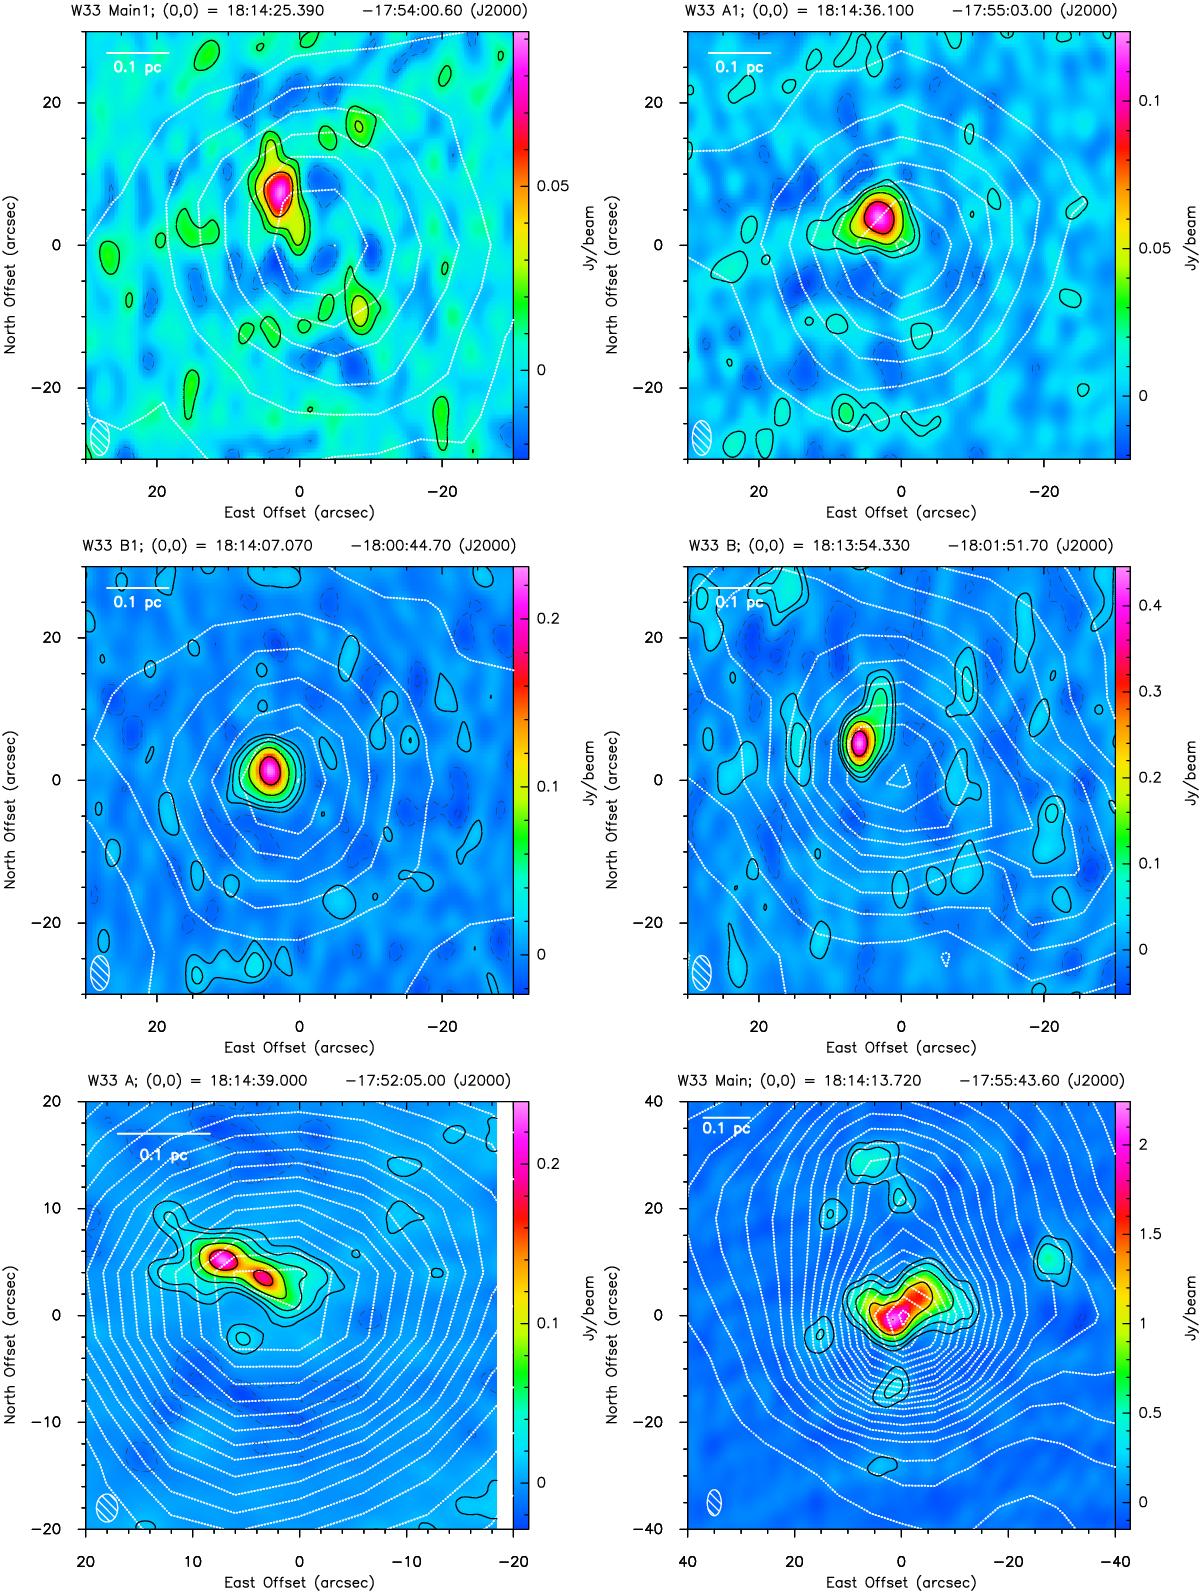
230 GHz continuum maps of W33 Main1, W33 A1, W33 B1, W33 B, W33 A, and W33 Main. The black contours are at −4, −2, 2, 4, 8, ... ·σ (1σ = 6, 5, 5, 10, 5, and 70 mJy beam-1). Negative contours are shown with a dashed line. The map of W33 A was obtained from Galván-Madrid et al. (2010). The synthesised beams are shown in the lower left corners of the images. In the upper left corners, a 0.1 pc scale is indicated. For comparison, the white contours show the ATLASGAL continuum emission at 345 GHz (same levels as in Figs. A.1−A.6).
Current usage metrics show cumulative count of Article Views (full-text article views including HTML views, PDF and ePub downloads, according to the available data) and Abstracts Views on Vision4Press platform.
Data correspond to usage on the plateform after 2015. The current usage metrics is available 48-96 hours after online publication and is updated daily on week days.
Initial download of the metrics may take a while.