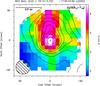
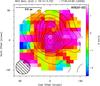
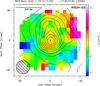
Fig. A.6
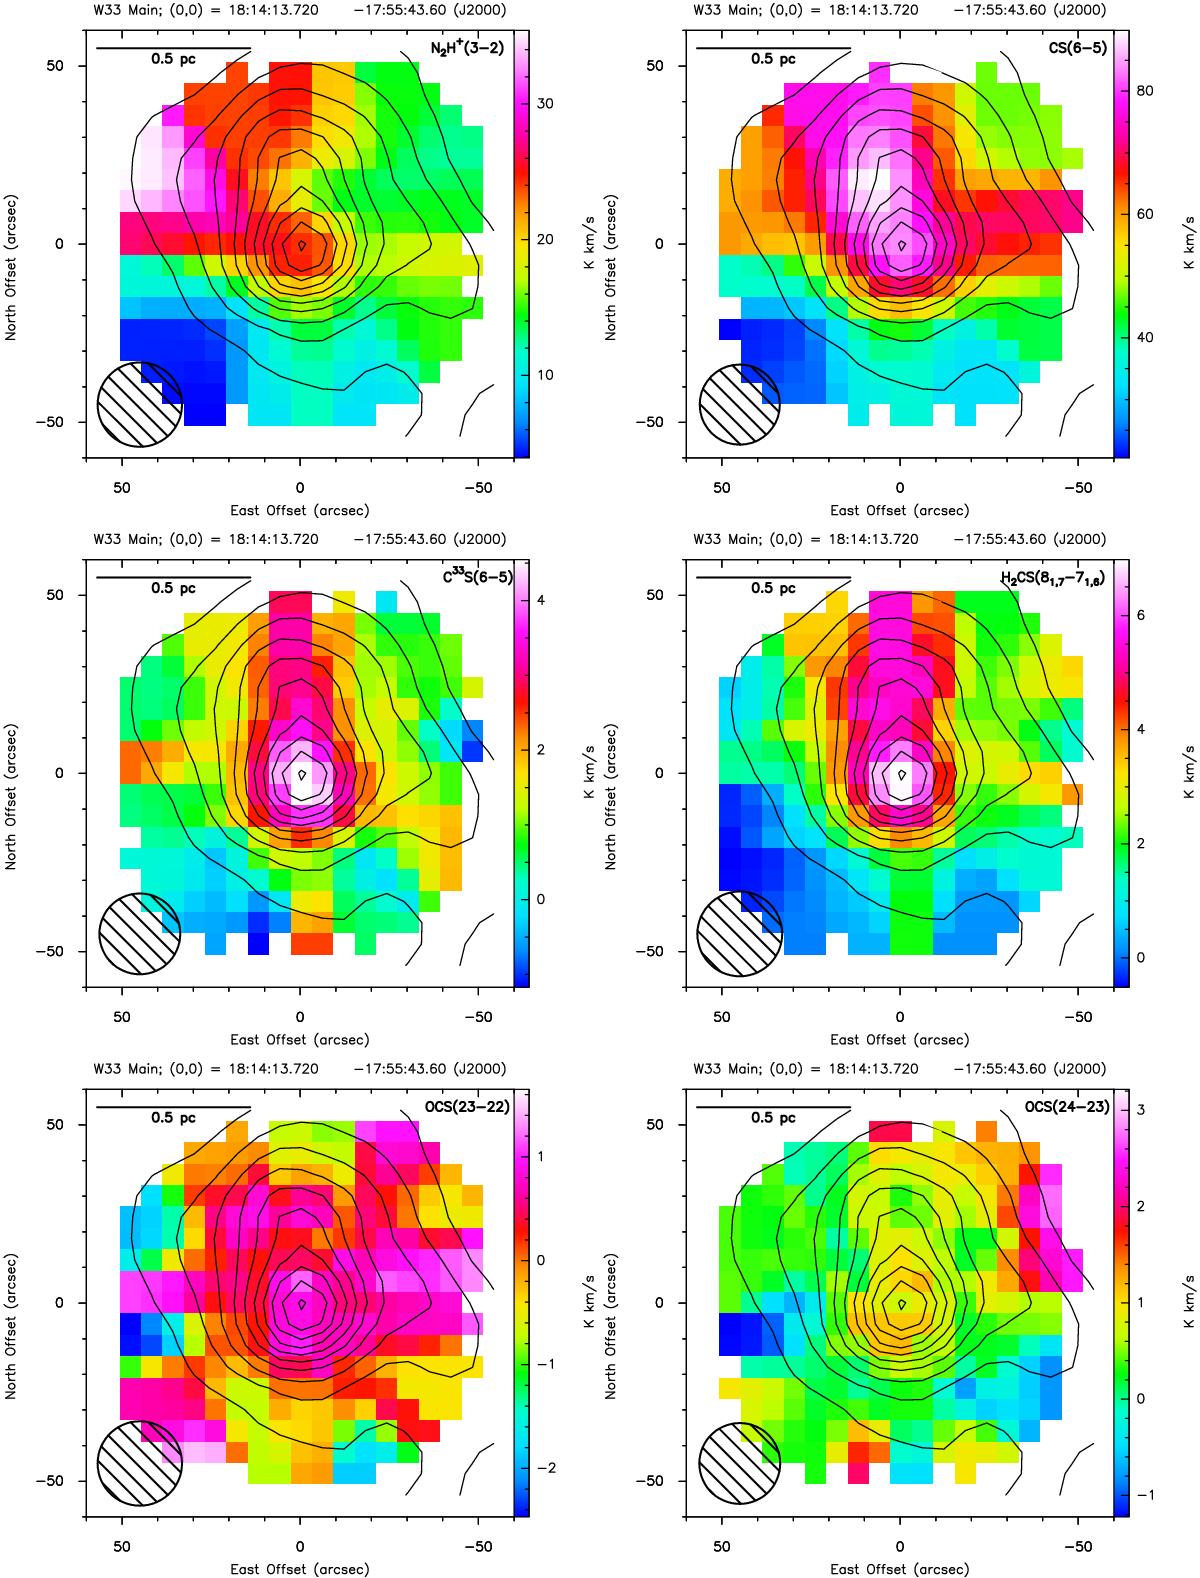
Line emission of detected transitions in W33 Main. The contours show the ATLASGAL continuum emission at 345 GHz (levels in steps of 40σ, starting at 50σ (σ = 0.081 Jy beam-1)). The name of the each transition is shown in the upper right corner. A scale of 0.5 pc is marked in the upper left corner, and the synthesised beam is shown in the lower left corner.
Current usage metrics show cumulative count of Article Views (full-text article views including HTML views, PDF and ePub downloads, according to the available data) and Abstracts Views on Vision4Press platform.
Data correspond to usage on the plateform after 2015. The current usage metrics is available 48-96 hours after online publication and is updated daily on week days.
Initial download of the metrics may take a while.