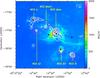
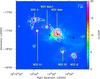
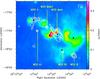
Fig. 1

High-mass star forming complex W33 and its surroundings. The background images show infrared and radio continuum emission at 8 μm (panel a)), 70 μm (panel b)), and 90 cm (panel c)), respectively. The contours show dust emission at 870 μm from the ATLASGAL survey (levels 1, 2, 4, 8, 16, and 32 Jy beam-1). Black and red crosses mark 6.7 GHz methanol and 22 GHz water masers, respectively. The positions of star clusters are indicated with black Xs. The pink circles in panel a) and the pink squares in panel b) show the sizes of the SMA mosaics and the covered areas of the OTF APEX maps, respectively.
Current usage metrics show cumulative count of Article Views (full-text article views including HTML views, PDF and ePub downloads, according to the available data) and Abstracts Views on Vision4Press platform.
Data correspond to usage on the plateform after 2015. The current usage metrics is available 48-96 hours after online publication and is updated daily on week days.
Initial download of the metrics may take a while.