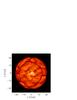
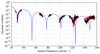
Fig. 10

Top: intensity map of the best-matching snapshot of RHD simulation at 2.2 μm (linear scale with a range of [0; 130 000] erg cm-2 s-1 Å-1. Bottom: comparison of the best fit snapshot with the AMBER continuum data. The AMBER squared visibilities are in black and the best fit squared visibilities of the simulation in red. The best fit LDD model is represented by the blue continuous line.
Current usage metrics show cumulative count of Article Views (full-text article views including HTML views, PDF and ePub downloads, according to the available data) and Abstracts Views on Vision4Press platform.
Data correspond to usage on the plateform after 2015. The current usage metrics is available 48-96 hours after online publication and is updated daily on week days.
Initial download of the metrics may take a while.