Fig. 7
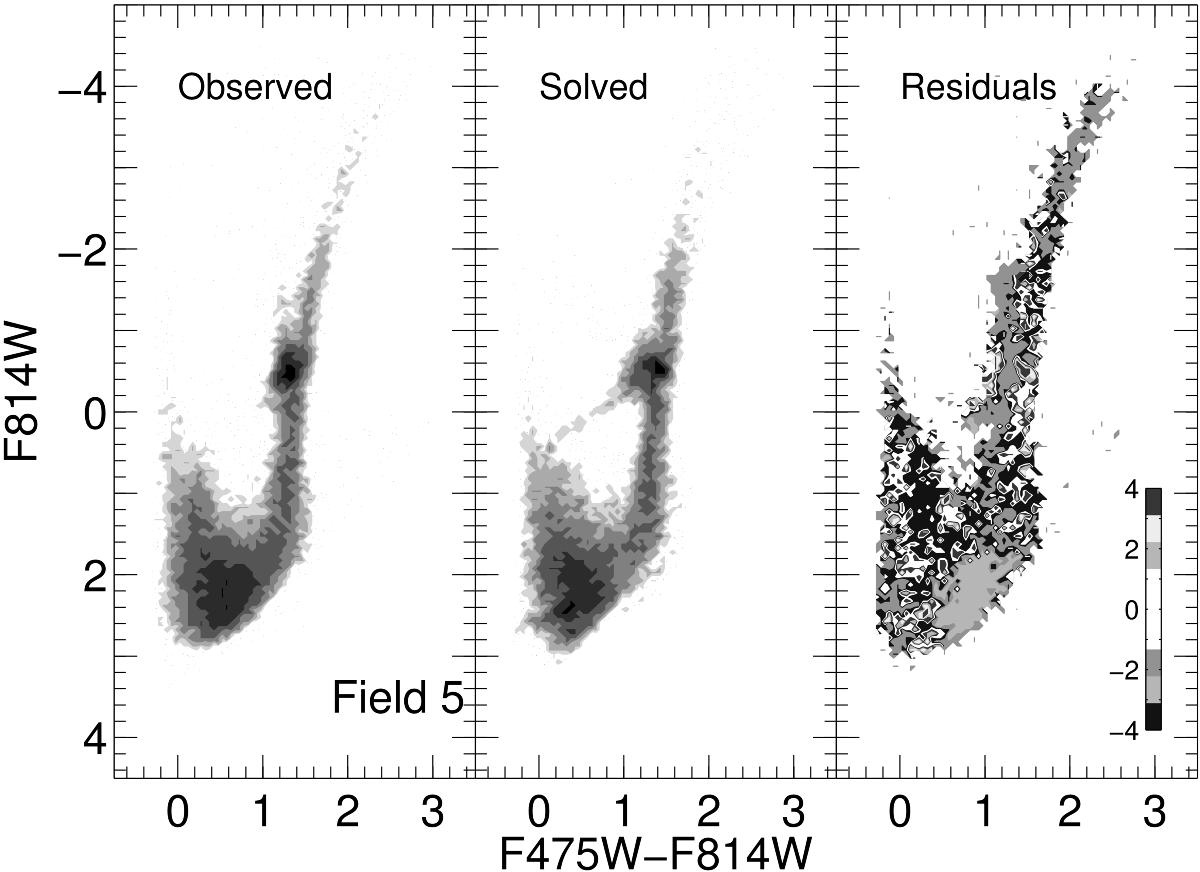
Left panel: observed CMD for Field 5. Central panel: the CMD according to the SF produced by IAC-pop/MinnIAC. Right panel: residuals obtained as the difference between the observed and the solution CMDs counted in different bins in units of Poisson errors. Different colours correspond to different errors in agreement with the scale shown in the right panel. A similar result is obtained for all the other fields.
Current usage metrics show cumulative count of Article Views (full-text article views including HTML views, PDF and ePub downloads, according to the available data) and Abstracts Views on Vision4Press platform.
Data correspond to usage on the plateform after 2015. The current usage metrics is available 48-96 hours after online publication and is updated daily on week days.
Initial download of the metrics may take a while.