Fig. 3
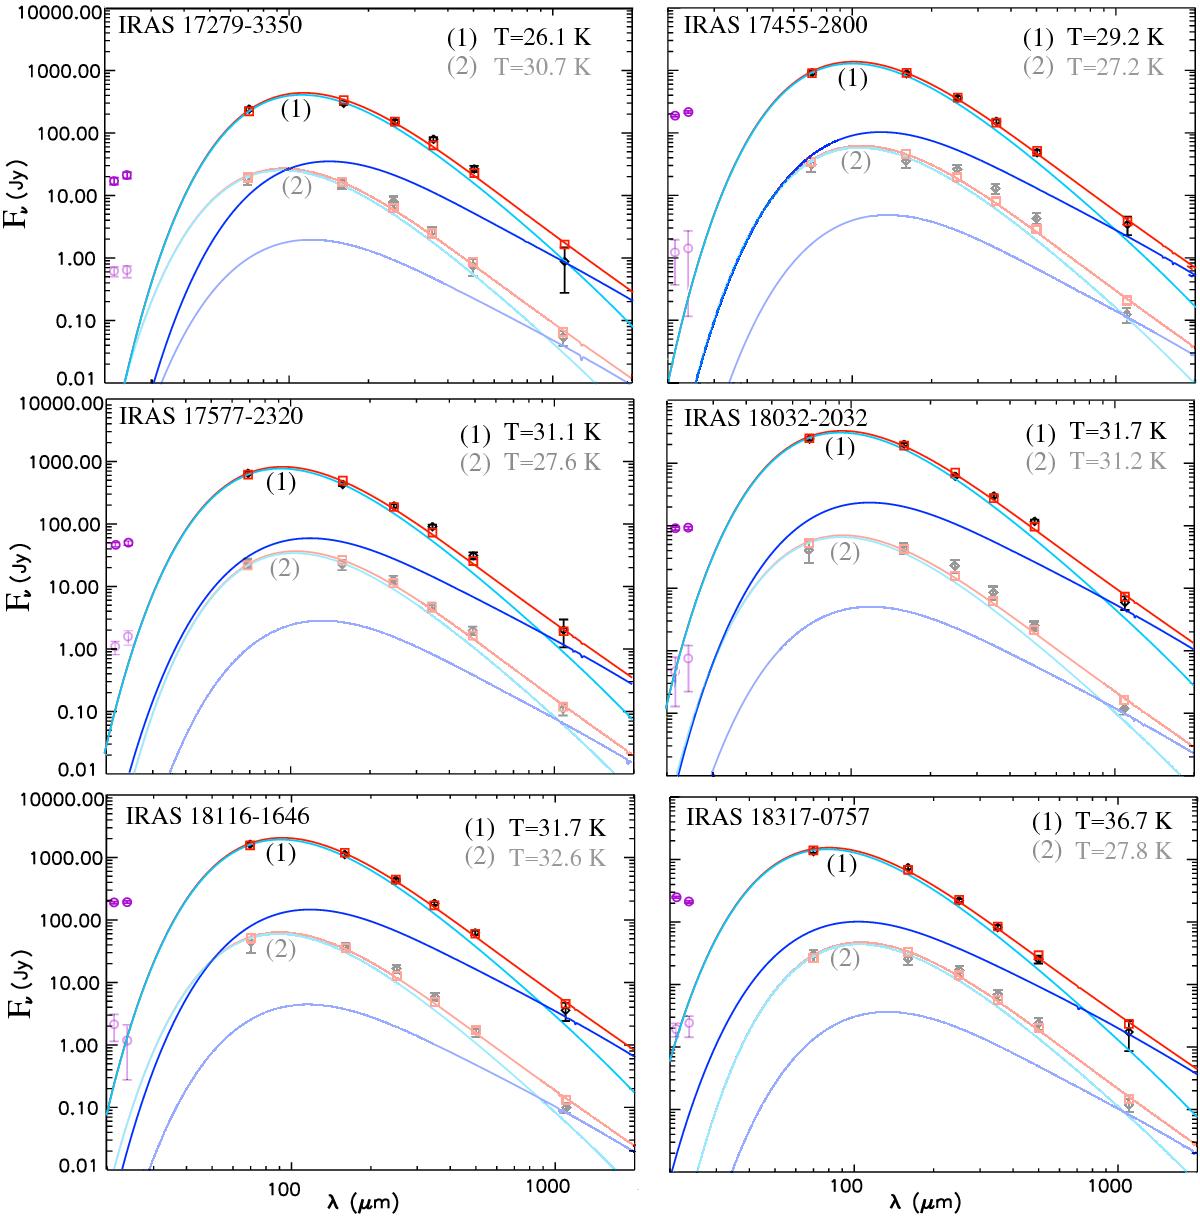
Herschel (70, 160, 250, 350, 500 μm) – Bolocam (1.1 mm) SED (black diamonds) of UCHII regions, fitted with the TLS model using the diffuse parameters (total emission in red, DCD and TLS processes in light and dark blue). Squares represent the model integrated in the band filters of each instrument, allowing direct comparisons with data (diamonds). SED corresponding to the central (1) and surrounding (2) part of the region are represented in dark and light colors. MSX data in band E (21.3 μm) and Spitzer data at 24 μm are also visible in the plots, represented by the purple circles.
Current usage metrics show cumulative count of Article Views (full-text article views including HTML views, PDF and ePub downloads, according to the available data) and Abstracts Views on Vision4Press platform.
Data correspond to usage on the plateform after 2015. The current usage metrics is available 48-96 hours after online publication and is updated daily on week days.
Initial download of the metrics may take a while.