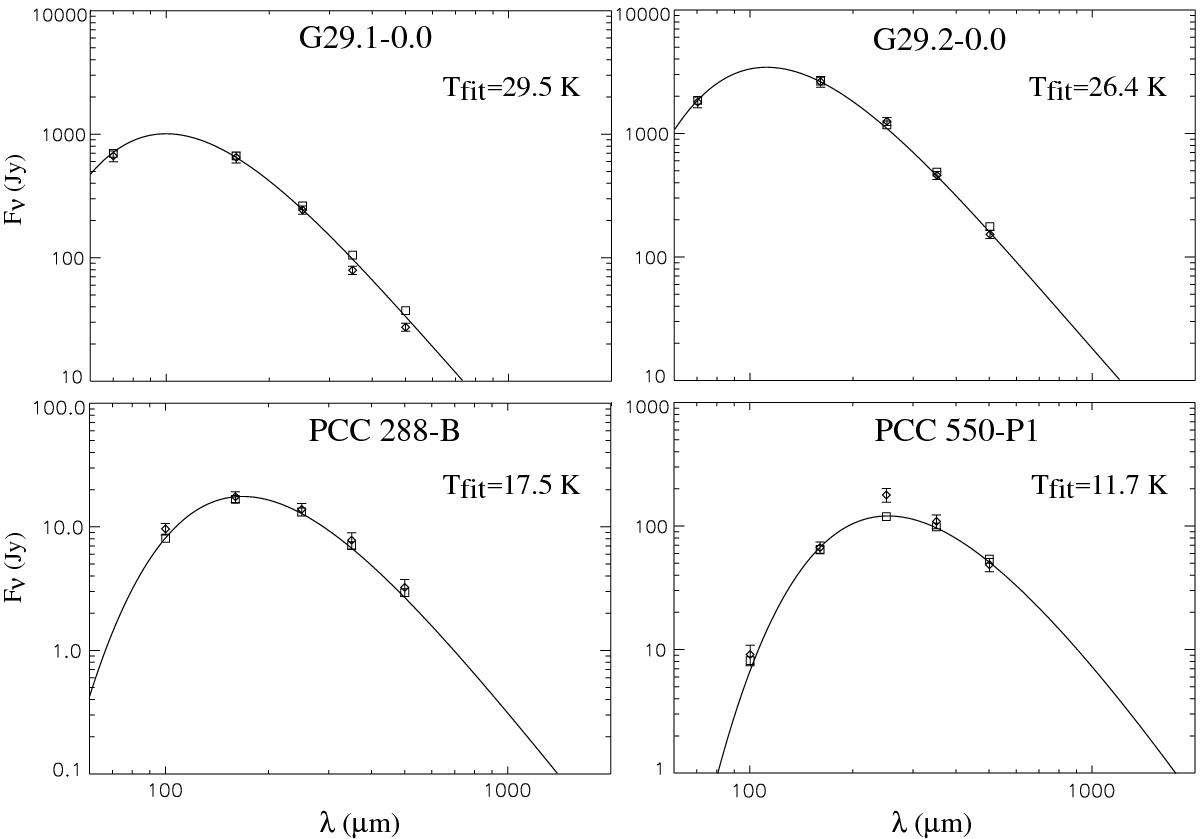
Fig. 8

Herschel SEDs (diamonds) of two UCHII regions G29.1-0.0 and G29.2-0.0 from Paladini et al. (2012) and two cold cores PCC 288-B and PCC 550-P1 from Juvela et al. (2010). Polynomial+Gaussian fits of the TLS model are represented by the continuous line between 100 μm and 2 mm. Squares represent the polynomial+Gaussian fit integrated in the band filters of each instrument which allow direct comparisons with the data (diamonds).
Current usage metrics show cumulative count of Article Views (full-text article views including HTML views, PDF and ePub downloads, according to the available data) and Abstracts Views on Vision4Press platform.
Data correspond to usage on the plateform after 2015. The current usage metrics is available 48-96 hours after online publication and is updated daily on week days.
Initial download of the metrics may take a while.


