Fig. 7
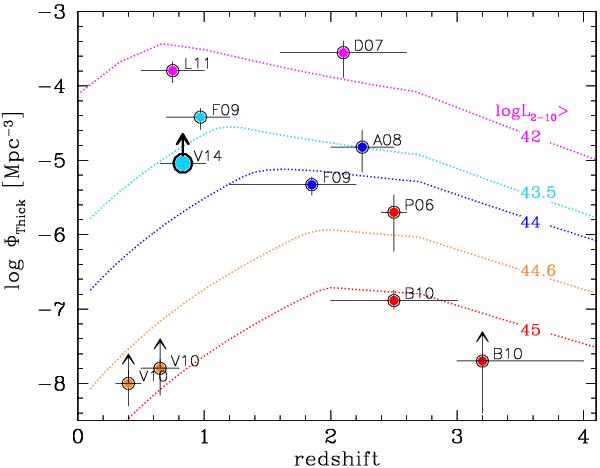
Space density of Compton-thick AGN samples with different intrinsic 2–10 keV luminosities compared with the XRB model predictions (Gilli et al. 2007). Datapoints have to be compared with the corresponding color curves; luminosity thresholds are as labeled. References to the observed densities, sorted by increasing luminosity threshold, and by increasing redshift for the same luminosity threshold, are as follows: L11: Luo et al. (2011); D07: Daddi et al. (2007b); V14: this work; F09: Fiore et al. (2009); A08: Alexander et al. (2008); V10: Vignali et al. (2010); P06: Polletta et al. (2006); B10: Bauer et al. (2010).
Current usage metrics show cumulative count of Article Views (full-text article views including HTML views, PDF and ePub downloads, according to the available data) and Abstracts Views on Vision4Press platform.
Data correspond to usage on the plateform after 2015. The current usage metrics is available 48-96 hours after online publication and is updated daily on week days.
Initial download of the metrics may take a while.