Fig. 1
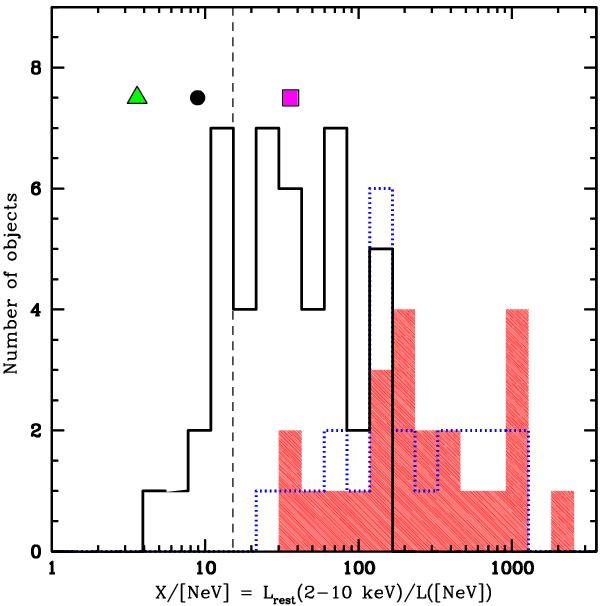
Distribution of the rest-frame 2–10 keV (with no correction for absorption) to [NeV] luminosity ratio (X/NeV) of the 69 zCOSMOS Type 2 AGN with reliable X-ray photometry. X-ray detections are reported as either red (filled) or blue (dotted) histograms; in particular, the red histogram refers to X-ray photometry obtained from the Acis Extract analysis carried out in the rest-frame 2–10 keV band, while the blue histogram reports the X-ray flux values derived from direct X-ray spectral fitting in the same energy band (see text for details). The black histogram refers to the X-ray undetected [Ne v]-selected Type 2 AGN. The vertical dashed line shows the threshold defined by G10 for Compton-thick (leftward direction) and Compton-thin (rightward direction) sources. All of the X-ray detected sources are likely Compton thin using the X/NeV threshold of 15 adopted by G10. The filled symbols represent the average X/NeV value obtained from the X-ray stacking analysis (black circle: stack of the 46 X-ray undetected Type 2 AGN; green triangle: stack of the 22 sources with “nominal” upper limit on the X/NeV ratio <30; magenta square: stack of the 24 sources with “nominal” upper limit on the X/NeV ratio >30; see Sect. 3.2 for details). Their y-axis position is arbitrary.
Current usage metrics show cumulative count of Article Views (full-text article views including HTML views, PDF and ePub downloads, according to the available data) and Abstracts Views on Vision4Press platform.
Data correspond to usage on the plateform after 2015. The current usage metrics is available 48-96 hours after online publication and is updated daily on week days.
Initial download of the metrics may take a while.