Fig. 5
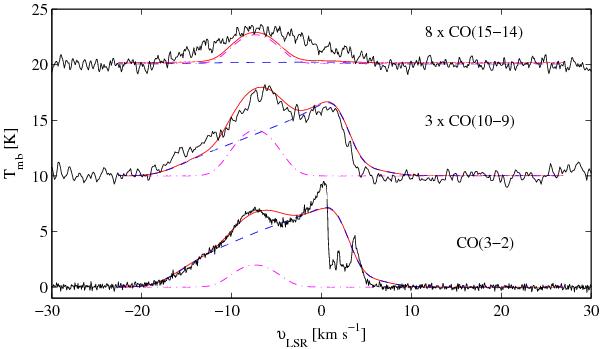
Observed CO (3−2), CO (10−9), and CO (15−14) spectra compared with the best-fit two-component model (red). The upper two lines have been shifted upwards and the foreground emission and absorption is not included in the model. The contributions from the bump and the expanding shell have been calculated separately and are indicated with dash-dotted purple and dashed blue lines, respectively.
Current usage metrics show cumulative count of Article Views (full-text article views including HTML views, PDF and ePub downloads, according to the available data) and Abstracts Views on Vision4Press platform.
Data correspond to usage on the plateform after 2015. The current usage metrics is available 48-96 hours after online publication and is updated daily on week days.
Initial download of the metrics may take a while.