Fig. 3
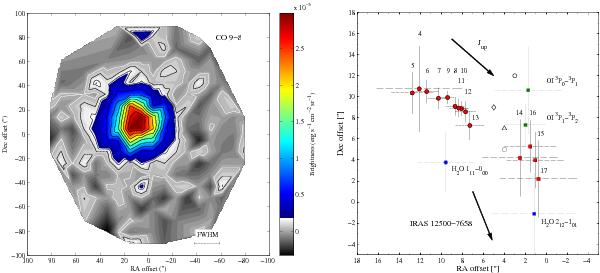
Left panel: CO (9–8) line emission obtained with SPIRE. The coloured contours show where the signal-to-noise ratio is higher than 5, the black line indicate the 3σ level and the white line the 1σ level. The FWHM of the SPIRE beam is indicated in the lower right corner of this figure. Right panel: red (CO), blue (H2O) and green ([O i]) markers show the location of the emission maximum with error bars from the Gaussian fit. The open square, circle, triangle and diamond show the peak positions of the fine-structure emission lines [Ne ii] 12.8 μm, [Fe ii] 26 μm, [S i] 25 μm, and [Si ii] 35 μm lines, respectively (Neufeld et al. 2006, Fig. 3). The arrows indicate the direction of increasing Jup for CO and the direction to IRAS 12 500–7658. The quantum numbers (only Jup for CO) are also shown in the figure. Angular offsets are given relative to the position of HH 54 B.
Current usage metrics show cumulative count of Article Views (full-text article views including HTML views, PDF and ePub downloads, according to the available data) and Abstracts Views on Vision4Press platform.
Data correspond to usage on the plateform after 2015. The current usage metrics is available 48-96 hours after online publication and is updated daily on week days.
Initial download of the metrics may take a while.