Fig. 1
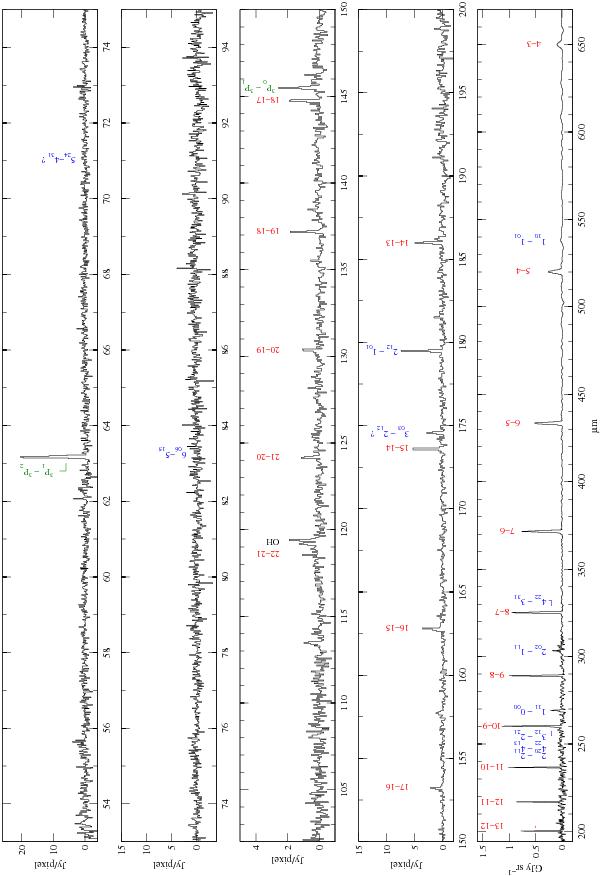
Upper four panels: PACS spectrum towards the central spaxel. Only lines that are detected with a signal-to-noise ratio greater than 3 somewhere in the mapped region (not necessarily the central spaxel) are marked as a detected line. Only upper and lower state energy levels are indicated for clarity. Lower panel: same as the other panels but for the SPIRE spectrum towards the central region. The [O i] lines are marked in green, the H2O lines in blue and the CO lines in red. In this figure, there are different units for the PACS and SPIRE observations and no continuum subtraction has been made.
Current usage metrics show cumulative count of Article Views (full-text article views including HTML views, PDF and ePub downloads, according to the available data) and Abstracts Views on Vision4Press platform.
Data correspond to usage on the plateform after 2015. The current usage metrics is available 48-96 hours after online publication and is updated daily on week days.
Initial download of the metrics may take a while.