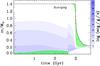
Fig. 4
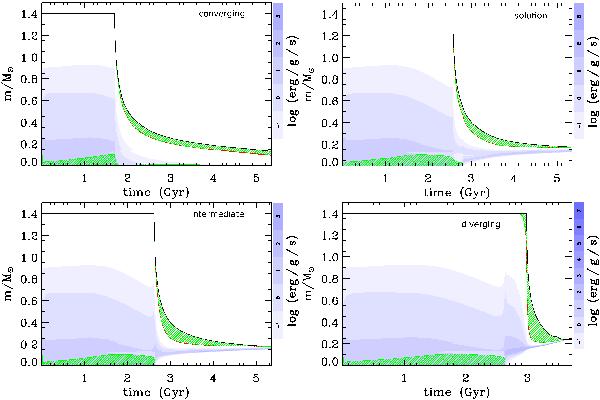
The Kippenhahn diagram of a converging (top left), solution (top right), intermediate (bottom left) and diverging (bottom right) LMXB system, respectively. In all cases we used M2 = 1.4 M⊙, MNS = 1.3MNS, γ = 5 and applied initial Porb = 2.6, 3.4, 3.45 and 4.2 days, respectively. These four systems are identical to the examples highlighted in Fig. 2. In the converging system the donor star experiences Case A RLO; for the solution and intermediate systems the mass transfer is either late Case A or early Case B RLO, while the diverging systems undergo Case B RLO. The plots show cross-sections of the stars in mass-coordinates from the centre to the surface of the star, along the y-axis, as a function of stellar age on the x-axis. For clarity, we only show the evolution up to a stellar age of 5.35 Gyr in the first three panels. The duration of the LMXB-phase is: “∞” (no detachment), 4.0 Gyr, 2.9 Gyr and 0.6 Gyr, respectively. The green hatched areas denote zones with convection (according to the Schwarzschild criterion), initially in the core and later in the envelope of the donor stars. The intensity of the blue color indicates the net energy-production rate; the hydrogen burning shell is clearly seen in the case of the solution, intermediate and diverging systems at m/M⊙ ≃ 0.2.
Current usage metrics show cumulative count of Article Views (full-text article views including HTML views, PDF and ePub downloads, according to the available data) and Abstracts Views on Vision4Press platform.
Data correspond to usage on the plateform after 2015. The current usage metrics is available 48-96 hours after online publication and is updated daily on week days.
Initial download of the metrics may take a while.