Fig. 12
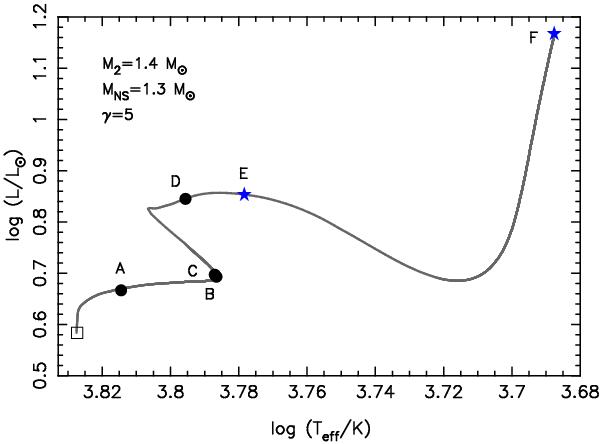
HR-diagram for the evolution of a 1.4 M⊙ star (Z = 0.02). Along the evolutionary track (starting from the ZAMS marked by a square) is shown the points where such a donor star would initiate RLO to a 1.3 M⊙ NS. The black circles represent the beginning of mass transfer for a system with initial Porb of 2.6 (A), 3.38 (B), 3.42 (C), 3.6 (D), 4.0 (E) and 7.0 days (F), respectively. The interval between the points E and F denote an epoch where the donor star experiences hydrogen shell flashes after the end of the mass-transfer phase.
Current usage metrics show cumulative count of Article Views (full-text article views including HTML views, PDF and ePub downloads, according to the available data) and Abstracts Views on Vision4Press platform.
Data correspond to usage on the plateform after 2015. The current usage metrics is available 48-96 hours after online publication and is updated daily on week days.
Initial download of the metrics may take a while.