Free Access
Fig. 11
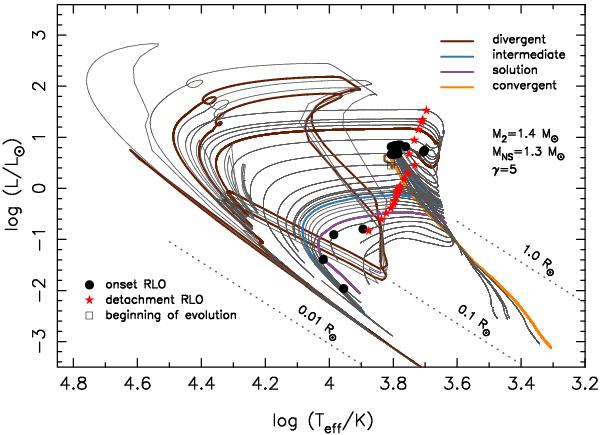
Evolutionary tracks in the HR-diagram for the systems shown in Fig. 2. The small square on the ZAMS near (log Teff,log (L/L⊙)) = (3.8,0.5) marks the beginning of the evolution for all systems.
Current usage metrics show cumulative count of Article Views (full-text article views including HTML views, PDF and ePub downloads, according to the available data) and Abstracts Views on Vision4Press platform.
Data correspond to usage on the plateform after 2015. The current usage metrics is available 48-96 hours after online publication and is updated daily on week days.
Initial download of the metrics may take a while.