Fig. 2
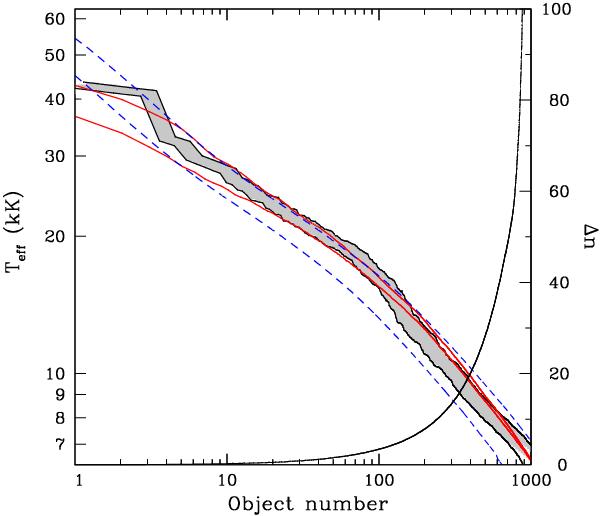
Distribution of effective temperatures as a function of the white dwarf object number (left axis). The observational values of Goldsbury et al. (2012) are displayed in the gray shaded area, while the results of our Monte Carlo simulations are shown with red lines. The blue dashed lines show the cooling sequence for MWD = 0.53 M⊙ of Renedo et al. (2010) for Z = 0.001 under different assumptions. The correction factor of the observed sample of white dwarfs is also displayed (right axis). See the online edition of the journal for a color version of this plot.
Current usage metrics show cumulative count of Article Views (full-text article views including HTML views, PDF and ePub downloads, according to the available data) and Abstracts Views on Vision4Press platform.
Data correspond to usage on the plateform after 2015. The current usage metrics is available 48-96 hours after online publication and is updated daily on week days.
Initial download of the metrics may take a while.