Fig. 2
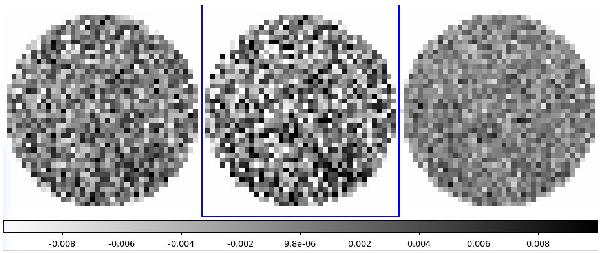
Map of colours g − r, g − i, and r − i (from left to right respectively) of mean colours of galaxies as a function of the projected clustercentric distance. The maps have a radius of 6 Mpc and a binning of 0.3 × 0.3 Mpc2. The mean colour of each map has been subtracted. The gray scale is linear and has an amplitude of 0.02 mag.
Current usage metrics show cumulative count of Article Views (full-text article views including HTML views, PDF and ePub downloads, according to the available data) and Abstracts Views on Vision4Press platform.
Data correspond to usage on the plateform after 2015. The current usage metrics is available 48-96 hours after online publication and is updated daily on week days.
Initial download of the metrics may take a while.