Fig. 1
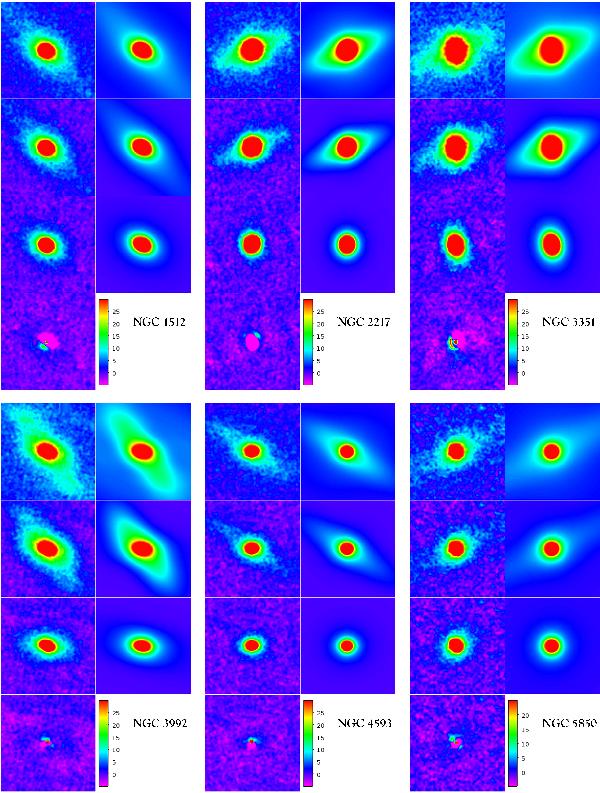
Illustration of the decomposition steps and residual images. For each galaxy in our sample each respective panel shows from top to bottom on the left-hand column, the original picture with sky background removed (1), then disc-subtracted (2). After fitting and subtracting a synthetic boxy or elliptical bar (3), the process is completed by modelling an elliptical bulge, trying to minimize the residuals (4). In the right column, the corresponding synthetic data show at the top the fitted disc+bar+bulge image followed by the bar+bulge image, and finally, the synthetic bulge alone. The colour scale units are expressed in ADUs.
Current usage metrics show cumulative count of Article Views (full-text article views including HTML views, PDF and ePub downloads, according to the available data) and Abstracts Views on Vision4Press platform.
Data correspond to usage on the plateform after 2015. The current usage metrics is available 48-96 hours after online publication and is updated daily on week days.
Initial download of the metrics may take a while.