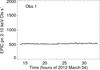
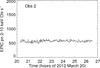
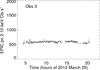
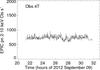
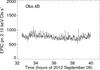
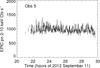
Fig. 2
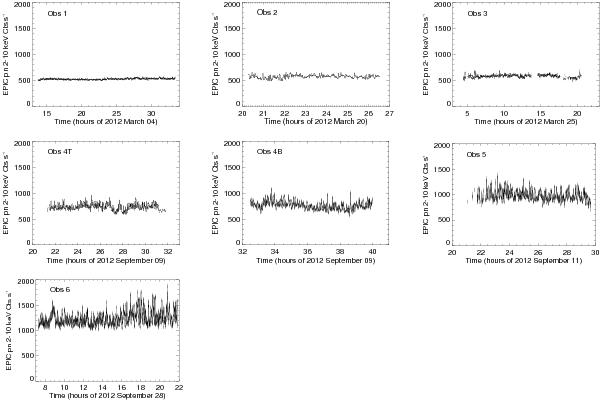
2−10 keV EPIC pn light curves with a binning of 64 s for obs 1−6. Time is shown in hours since the beginning of the observation. The y-axis scale is the same for all observations. Note that obs 4 is split into two parts: 4T was stopped shortly before 08:00 UT on September 10 and 4B was started immediately after (see text for more details).
Current usage metrics show cumulative count of Article Views (full-text article views including HTML views, PDF and ePub downloads, according to the available data) and Abstracts Views on Vision4Press platform.
Data correspond to usage on the plateform after 2015. The current usage metrics is available 48-96 hours after online publication and is updated daily on week days.
Initial download of the metrics may take a while.