Fig. 6
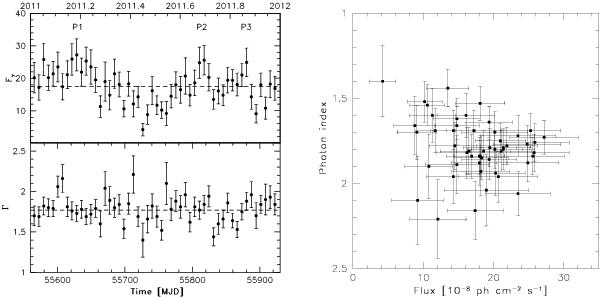
0.1–100 GeV flux in units of 10-8 ph cm-2 s-1 (top panel) and the spectral photon index from a power-law fit (bottom panel) for Mrk 421 for time intervals on one week during 2011 (from MJD 55 562 to MJD 55 926). The dashed line in both panels represents the mean value. In the right frame we show the scatter plot of the photon index vs the γ-ray flux.
Current usage metrics show cumulative count of Article Views (full-text article views including HTML views, PDF and ePub downloads, according to the available data) and Abstracts Views on Vision4Press platform.
Data correspond to usage on the plateform after 2015. The current usage metrics is available 48-96 hours after online publication and is updated daily on week days.
Initial download of the metrics may take a while.