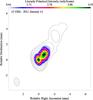
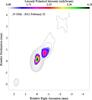
Fig. 1
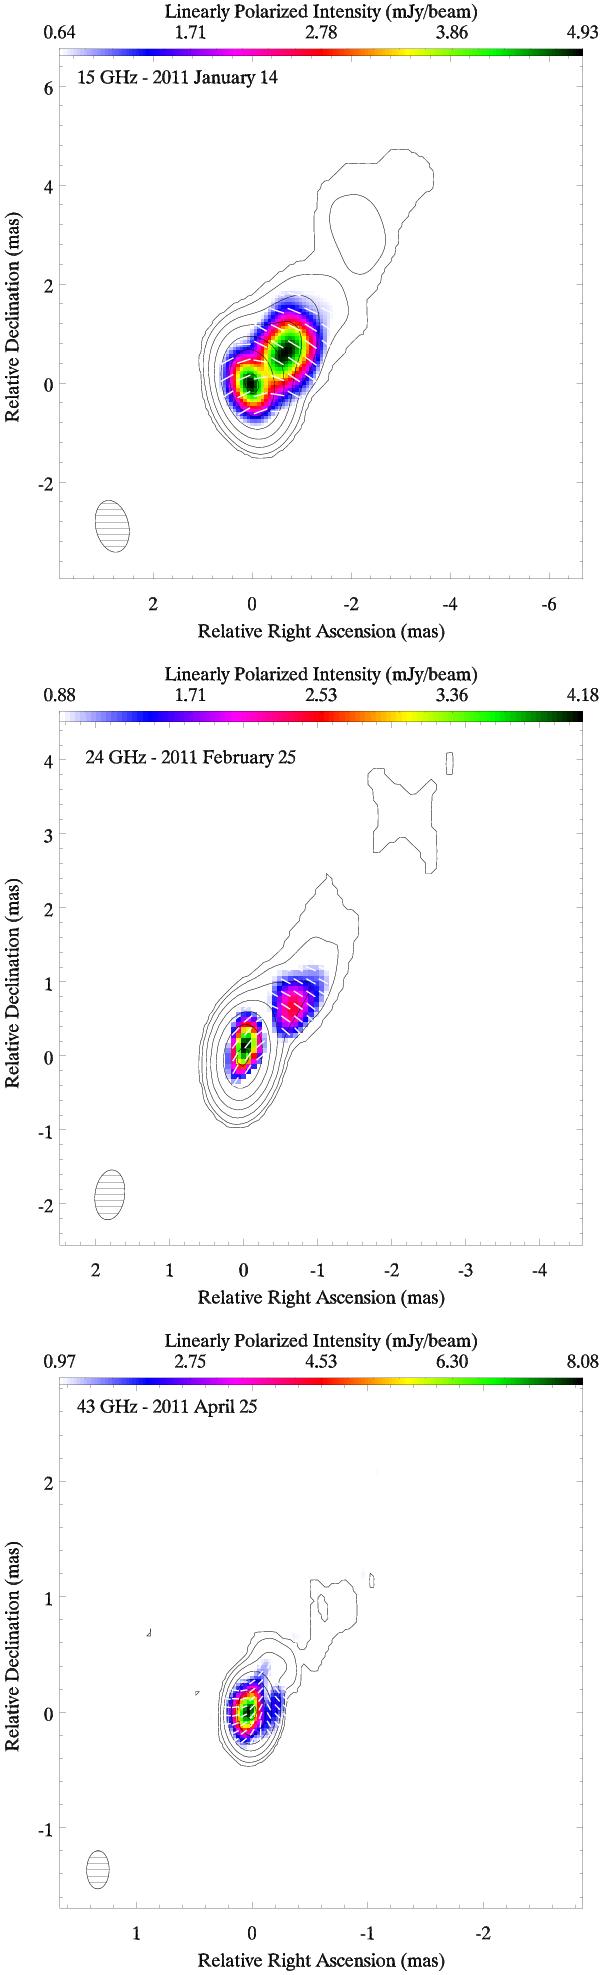
Images of Mrk 421 for the first observing epoch at 15 GHz (top image), the second observing epoch at 24 GHz (central image), and the third observing epoch at 43 GHz (bottom image). Levels are drawn at (−1,1,2,4...) × the lowest contour (that is, at 1.0 mJy/beam for 15 and 24 GHz images and at 0.65 mJy/beam for the 43 GHz image) increasing by factors of 2. The restoring beam, shown in the bottom left corner, has a value of 1.05 mas × 0.66 mas, 0.67 mas × 0.40 mas, and 0.33 mas × 0.19 mas for 15, 24, and 43 GHz, respectively. The overlaid color maps show the linearly polarized intensity, and bars represent the absolute orientation of the EVPAs.
Current usage metrics show cumulative count of Article Views (full-text article views including HTML views, PDF and ePub downloads, according to the available data) and Abstracts Views on Vision4Press platform.
Data correspond to usage on the plateform after 2015. The current usage metrics is available 48-96 hours after online publication and is updated daily on week days.
Initial download of the metrics may take a while.