Free Access
Fig. 9
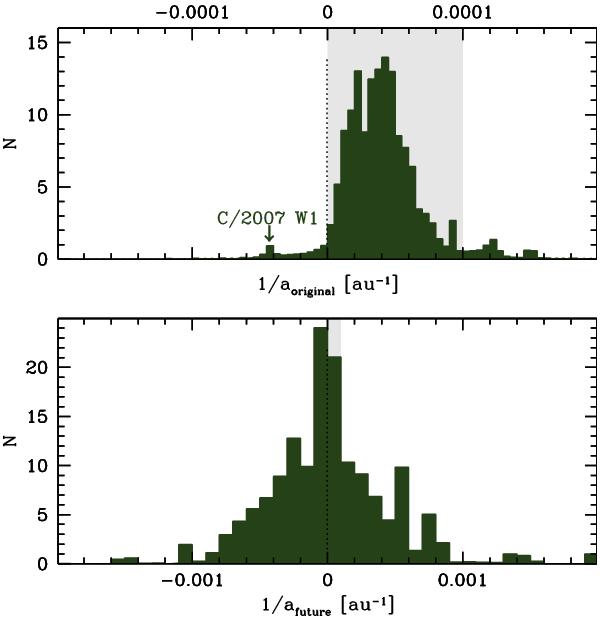
Same as in the top and middle panels of Fig. 7, but including 119 comets taken from Królikowska (2014). Both distributions are composed of 157 individual normalized 1 /a-distributions, each resulting from the dynamical calculations of 5001 VCs.
Current usage metrics show cumulative count of Article Views (full-text article views including HTML views, PDF and ePub downloads, according to the available data) and Abstracts Views on Vision4Press platform.
Data correspond to usage on the plateform after 2015. The current usage metrics is available 48-96 hours after online publication and is updated daily on week days.
Initial download of the metrics may take a while.