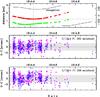
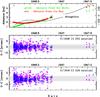
Fig. 2

O–C diagrams for comets C/1914 F1 Kritzinger (left-hand panels) and C/1946 C1 Timmers (right-hand panels). Upper panels show the time distribution of positional observations with corresponding heliocentric (red curve) and geocentric (green curve) distance at which they were taken (left-hand vertical axes). Horizontal dotted lines show the perihelion distance and vertical dotted lines the moment of perihelion passage. Dark grey curves represent the change of the comet’s elongation within the observed time intervals (right-hand vertical axes range from −180 to 180 degrees). The second panels from the top present the O–C based on NG solutions, the third panels show O–C based on a pure GR orbit. Residuals in right ascension are shown as magenta dots and in declination as blue open circles. The lowest panels show the comparison between the normalized weights of data between NG solution (dark blue points) and GR solution (light steel-blue points).
Current usage metrics show cumulative count of Article Views (full-text article views including HTML views, PDF and ePub downloads, according to the available data) and Abstracts Views on Vision4Press platform.
Data correspond to usage on the plateform after 2015. The current usage metrics is available 48-96 hours after online publication and is updated daily on week days.
Initial download of the metrics may take a while.