Fig. 7
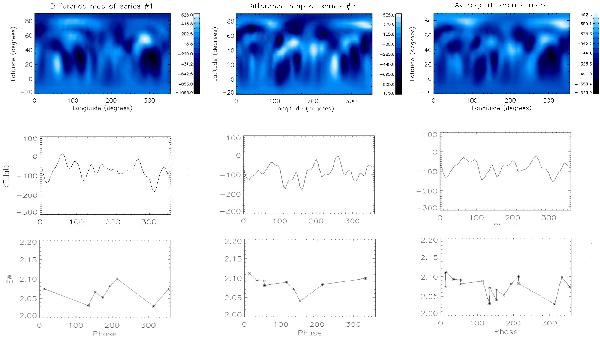
Top panels: difference maps by substracting the Li-maps from the corresponding Ca+Fe average maps of the subsequent series (plotted in Fig. 5). In the last column, plotted are the averaged difference maps. Note the similar high-latitude features at ≈ 0° and ≈ 230° and the low-latitude ones around 150° and 300°. Middle panels: the difference maps are averaged latitudinally. Bottom panels: measured equivalent widths of the Li i 6708 line.
Current usage metrics show cumulative count of Article Views (full-text article views including HTML views, PDF and ePub downloads, according to the available data) and Abstracts Views on Vision4Press platform.
Data correspond to usage on the plateform after 2015. The current usage metrics is available 48-96 hours after online publication and is updated daily on week days.
Initial download of the metrics may take a while.