Free Access
Fig. 2
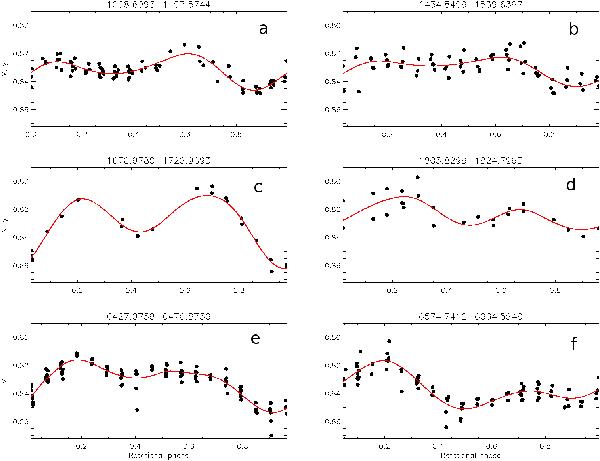
V + y (panels a)–d)) and V (panels e)–f)) data from six different timespans between 8 Oct. 1998 and 7 Jan. 2014 (corresponding HJDs–2 450 000 are seen on the top of the panels). Dots are the measurements, the continous line shows the fitted spot model.
Current usage metrics show cumulative count of Article Views (full-text article views including HTML views, PDF and ePub downloads, according to the available data) and Abstracts Views on Vision4Press platform.
Data correspond to usage on the plateform after 2015. The current usage metrics is available 48-96 hours after online publication and is updated daily on week days.
Initial download of the metrics may take a while.