Free Access
Fig. 1
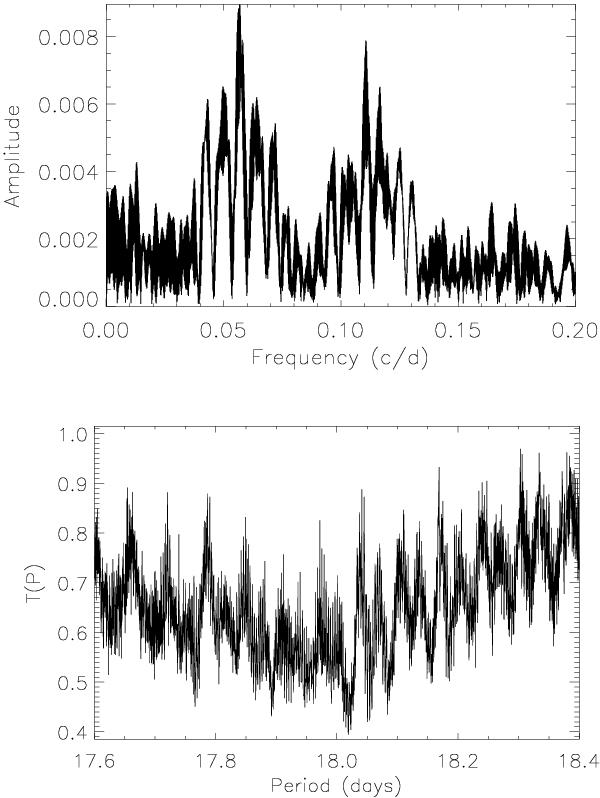
Top panel: power spectrum of all avaible V and y data. The two peaks at 0.0561 and 0.1098 cycles/day correspond to Prot = 17.82 d and Prot = 9.11 d, respectively. Bottom panel: result of the SLLK fit (see Sect. 3 fo the details). The best fit is at P = 18.020 ± 0.006 d.
Current usage metrics show cumulative count of Article Views (full-text article views including HTML views, PDF and ePub downloads, according to the available data) and Abstracts Views on Vision4Press platform.
Data correspond to usage on the plateform after 2015. The current usage metrics is available 48-96 hours after online publication and is updated daily on week days.
Initial download of the metrics may take a while.