Fig. 6
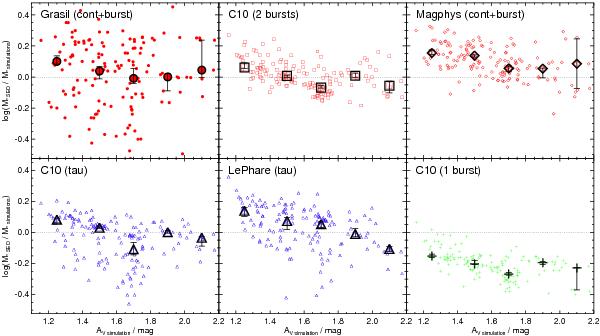
Ratio of the stellar masses derived from the SED modelling and the true stellar masses in the simulation as a function of optical V-band dust attenuation in the simulation. Dotted lines indicate agreement between these masses. Large symbols with error bars represent the medians in the AV bins. When a single-component (i.e., tau or single-burst) SFH is assumed, the recovered-to-true stellar mass ratio tends to decrease with increasing AV.
Current usage metrics show cumulative count of Article Views (full-text article views including HTML views, PDF and ePub downloads, according to the available data) and Abstracts Views on Vision4Press platform.
Data correspond to usage on the plateform after 2015. The current usage metrics is available 48-96 hours after online publication and is updated daily on week days.
Initial download of the metrics may take a while.