Fig. 13
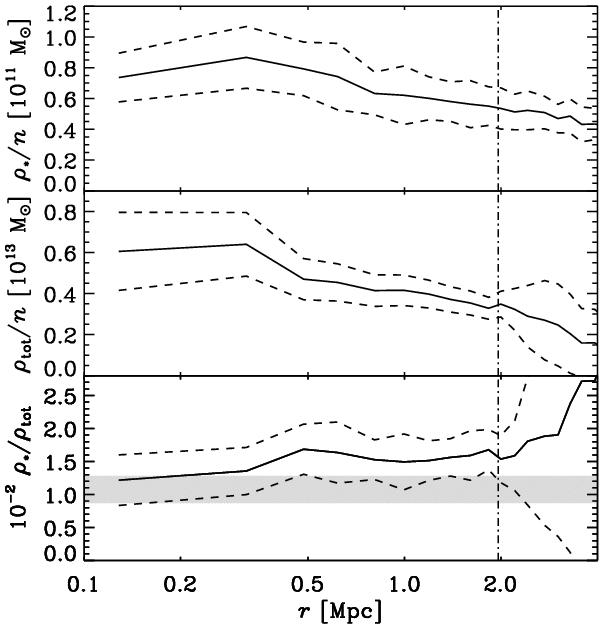
Top panel: the ratio of the stellar mass density and number density profiles. Middle panel: the ratio of the total mass density and number density profiles. Bottom panel: the ratio of the stellar mass density and total mass density profiles. Dashed lines indicate 1σ confidence regions. All densities are volume densities. The vertical dash-dotted line indicates the location of r200. The horizontal gray area indicates the cosmic value of the stellar mass fraction at the cluster mean redshift and its 1σ uncertainty.
Current usage metrics show cumulative count of Article Views (full-text article views including HTML views, PDF and ePub downloads, according to the available data) and Abstracts Views on Vision4Press platform.
Data correspond to usage on the plateform after 2015. The current usage metrics is available 48-96 hours after online publication and is updated daily on week days.
Initial download of the metrics may take a while.