Free Access
Fig. 12
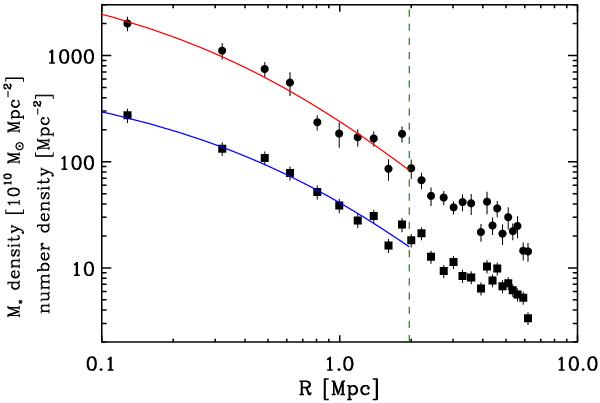
The stellar mass density profile (dots) and the number density profile (squares) and their best-fit projected NFW models (red and blue curves). The 1σ errors are shown, and evaluated using a bootstrap procedure. Both densities are space densities. The vertical dashed green line indicates the location of r200.
Current usage metrics show cumulative count of Article Views (full-text article views including HTML views, PDF and ePub downloads, according to the available data) and Abstracts Views on Vision4Press platform.
Data correspond to usage on the plateform after 2015. The current usage metrics is available 48-96 hours after online publication and is updated daily on week days.
Initial download of the metrics may take a while.