Fig. 9
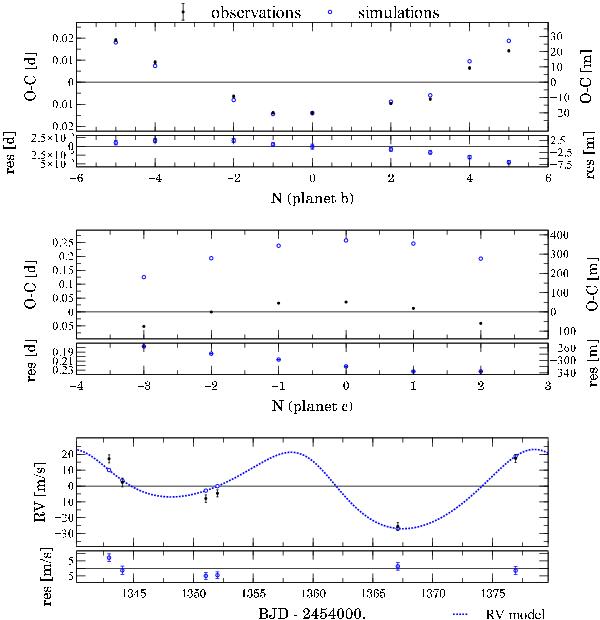
O-C diagrams (with residuals) from linear ephemeris for planet Kepler-9b (top panel) and Kepler-9c (middle panel) with the discovery paper’s parameters (see column two of Table 6); observations plotted as solid black circles, simulations plotted as open blue circles. The parameter N, in the abscissa, has the same meaning of Fig. 7. Bottom panel shows the RV observations as solid black circles, simulations at the same BJDUTC as open blue circles, and the dotted blue line is the RV model for the whole simulation.
Current usage metrics show cumulative count of Article Views (full-text article views including HTML views, PDF and ePub downloads, according to the available data) and Abstracts Views on Vision4Press platform.
Data correspond to usage on the plateform after 2015. The current usage metrics is available 48-96 hours after online publication and is updated daily on week days.
Initial download of the metrics may take a while.