Fig. 7
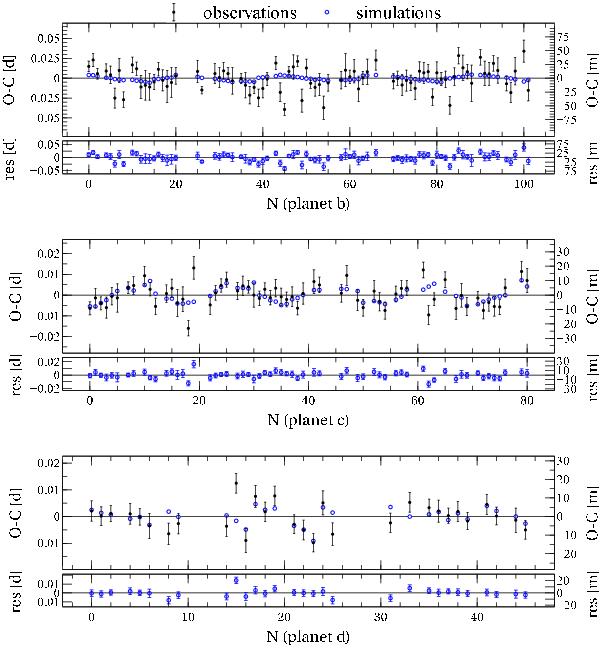
O-C diagrams for planets b, c, and d (from top to bottom) of the Kepler-11 system; the black filled circles are the observed points fitted by a linear ephemeris, the blue open circles are the simulated points fitted by the same linear ephemeris of the observations. The simulated points are calculated from the solution K11-III (best simulation in Fig. 6) in Table 2. Residual plots, as the difference between observed and simulated central time (T0,obs − T0,sim), are in the lower panel of each O-C plot. The unit of measurement of the left O-C y-axis is days (d) and minutes (m) are on the right. The N in the abscissa identifies the transit number respect to the reference transit time of the ephemeris of each body (second column of Table 3).
Current usage metrics show cumulative count of Article Views (full-text article views including HTML views, PDF and ePub downloads, according to the available data) and Abstracts Views on Vision4Press platform.
Data correspond to usage on the plateform after 2015. The current usage metrics is available 48-96 hours after online publication and is updated daily on week days.
Initial download of the metrics may take a while.