Fig. 3
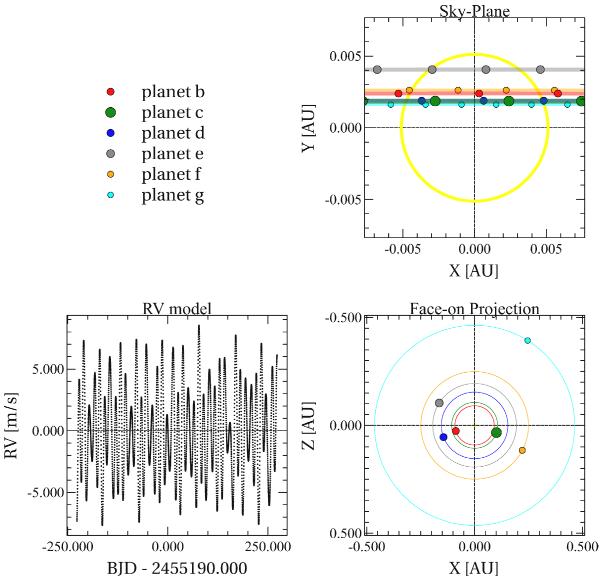
Orbits of the Kepler-11 system with initial parameters from Lis2011 model (circular model, see Table 2). The planet marker size is scaled with the mass of the planet. Top-right: “Sky Plane”, Kepler-11 system as seen from the Kepler satellite; we plotted only one orbit near a transit for each planet. Each circle is the position of a planet at a given integration time step. Bottom-right: projection of the system as seen face on. The big markers are the initial points of the integration. Bottom-left: RV model from the simulation.
Current usage metrics show cumulative count of Article Views (full-text article views including HTML views, PDF and ePub downloads, according to the available data) and Abstracts Views on Vision4Press platform.
Data correspond to usage on the plateform after 2015. The current usage metrics is available 48-96 hours after online publication and is updated daily on week days.
Initial download of the metrics may take a while.