Fig. 2
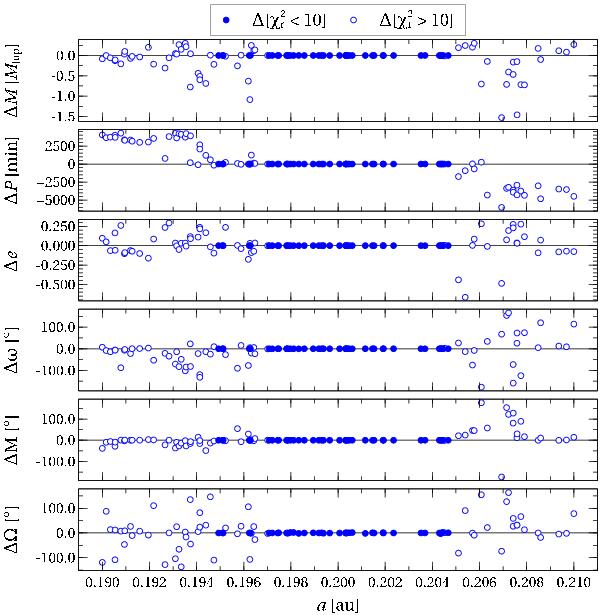
Variations (Δ) of the fitted parameters for different initial values of the semi-major axis of the planet c; each point corresponds to a different simulation. In this case, the input parameters (of planet c) are the parameters in Table 1 used to generate the exact transit times. The goodness of the fit has been color-coded so that good fits ( ) have been plotted as blue points and bad fits (
 ) as open circles. The small gaps are due to the random sampling used to generate the grid in the semi-major axis a.
Current usage metrics show cumulative count of Article Views (full-text article views including HTML views, PDF and ePub downloads, according to the available data) and Abstracts Views on Vision4Press platform.
Data correspond to usage on the plateform after 2015. The current usage metrics is available 48-96 hours after online publication and is updated daily on week days.
Initial download of the metrics may take a while.