Fig. 11
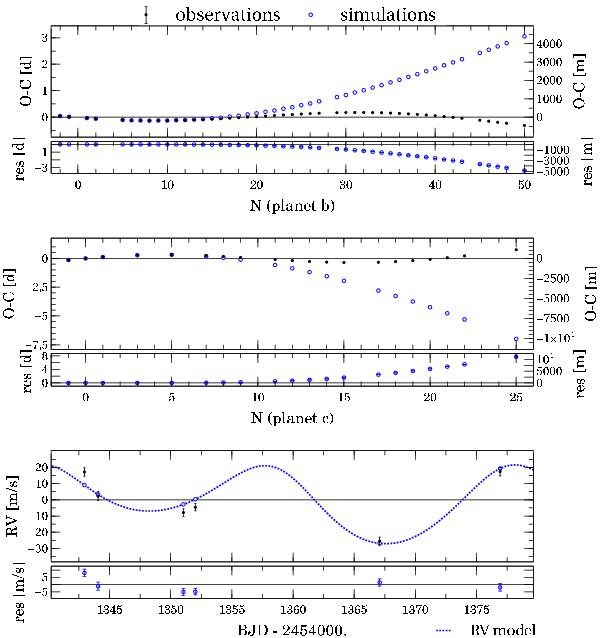
Kepler-9 system: O-C diagrams from the parameters obtained (solution K9-I in Table 6) with TRADES for the data from Holman et al. (2010) extended to the twelve quarters of Kepler. The simulations are compared with the T0s from Mazeh et al. (2013), while the RVs are from the discovery paper. The epoch of the transits (N in x-axis) are calculated from the linear ephemeris from Mazeh et al. (2013).
Current usage metrics show cumulative count of Article Views (full-text article views including HTML views, PDF and ePub downloads, according to the available data) and Abstracts Views on Vision4Press platform.
Data correspond to usage on the plateform after 2015. The current usage metrics is available 48-96 hours after online publication and is updated daily on week days.
Initial download of the metrics may take a while.