Fig. 2
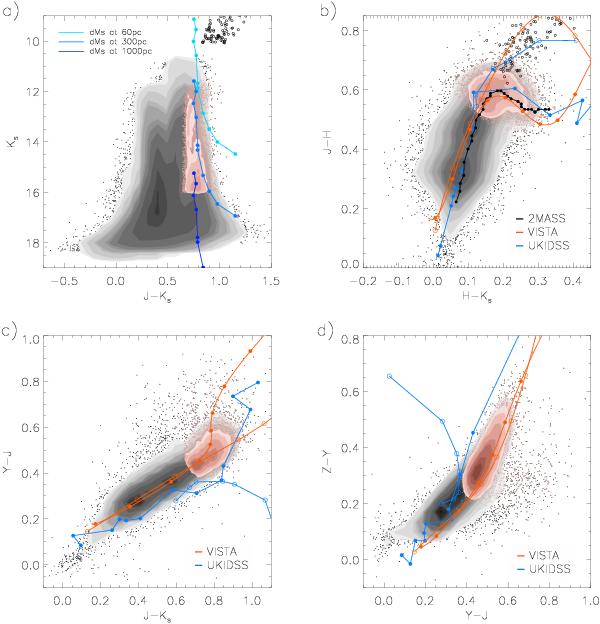
Colour–magnitude diagram and colour-colour diagrams for objects classified as stellar in the tile b201. The colour-based selection of M dwarfs is shown in pink in all diagrams. Black open circles are giant stars located at similar (l,b) as b201 by the BRaVA Project (Rich et al. 2007; Kunder et al. 2012). a) The colour identified M dwarfs fill the region that agrees with the K+M dwarf sequence in the (J − Ks,Ks) CMD of the outermost region in the VVV bulge area, identified by Saito et al. (2012b). The estimated M dwarf spectral sequences at 60 pc, 300 pc, and 1000 pc are shown. b)–d) (H − Ks,J − H), (J − Ks,Y − J), and (Y − J,Z − Y) diagrams for all stellar objects with 12 <Ks< 16 only. The blue lines represent the dwarf (filled circles) and giant (open circles) sequences, based on UKIDSS synthetic colours by Hewett et al. (2006). The orange lines represent the dwarf (filled circles) and giant (open circles) sequences, based on VISTA synthetic colours derived from stars in the IRTF Spectral Library (see Appendix A). In the (H − Ks,J − H) diagram, the black line corresponds to the JHKs stellar locus by Covey et al. (2007), derived from SDSS and 2MASS photometry), and it is in agreement with the one derived in this work from VISTA synthetic colours. The disagreement between the UKIDSS and VISTA sequences may be due to the differences between the Z and Y synthetic filters of each survey.
Current usage metrics show cumulative count of Article Views (full-text article views including HTML views, PDF and ePub downloads, according to the available data) and Abstracts Views on Vision4Press platform.
Data correspond to usage on the plateform after 2015. The current usage metrics is available 48-96 hours after online publication and is updated daily on week days.
Initial download of the metrics may take a while.