Free Access
Fig. 7
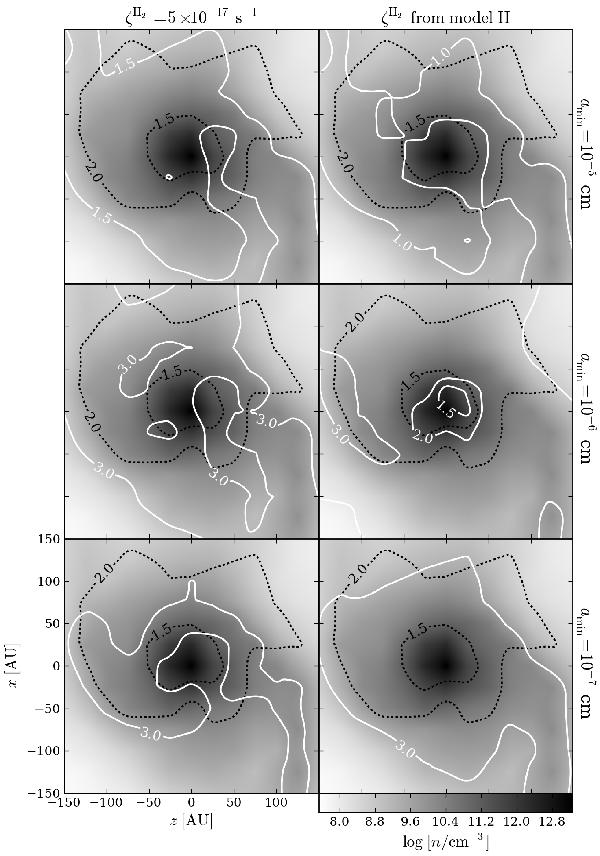
Diffusion time contours (white solid lines) evaluated with constant ζH2= 5 × 10-17 s-1 (left column) and ζH2 from model H in Table 1 (right column) compared with dynamical time contours (black dashed lines) for three different values of the minimum grain size. Labels show log 10(t/ yr).
Current usage metrics show cumulative count of Article Views (full-text article views including HTML views, PDF and ePub downloads, according to the available data) and Abstracts Views on Vision4Press platform.
Data correspond to usage on the plateform after 2015. The current usage metrics is available 48-96 hours after online publication and is updated daily on week days.
Initial download of the metrics may take a while.