Fig. 4
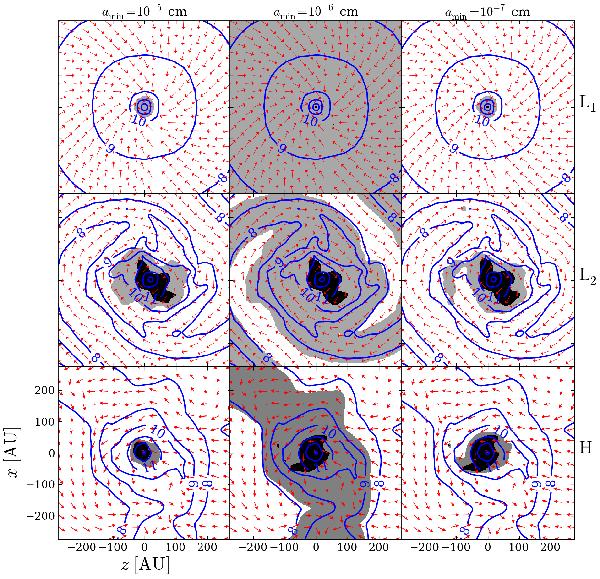
Density contours (solid blue lines with labels indicating log 10 [ n/ cm-3 ]) superposed to the velocity field (red arrows). The shaded areas show regions dominated by ambipolar (white), Hall (grey), and Ohmic (black) diffusion. The resistivities are calculated for three different values of amin and for the three models L1, L2, and H.
Current usage metrics show cumulative count of Article Views (full-text article views including HTML views, PDF and ePub downloads, according to the available data) and Abstracts Views on Vision4Press platform.
Data correspond to usage on the plateform after 2015. The current usage metrics is available 48-96 hours after online publication and is updated daily on week days.
Initial download of the metrics may take a while.