Free Access
Fig. 1
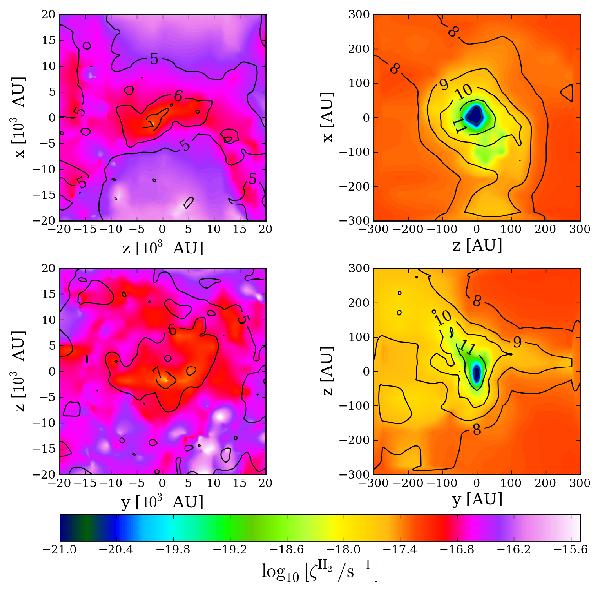
CR ionisation maps and iso-density contours (black solid lines) for the case H in Table 1. Left panels: entire computational domain while right panels: a zoom in the inner region. Upper and lower panels: two perpendicular planes both containing the density peak. Labels show log 10 [ n/ cm-3 ].
Current usage metrics show cumulative count of Article Views (full-text article views including HTML views, PDF and ePub downloads, according to the available data) and Abstracts Views on Vision4Press platform.
Data correspond to usage on the plateform after 2015. The current usage metrics is available 48-96 hours after online publication and is updated daily on week days.
Initial download of the metrics may take a while.