Fig. A.3
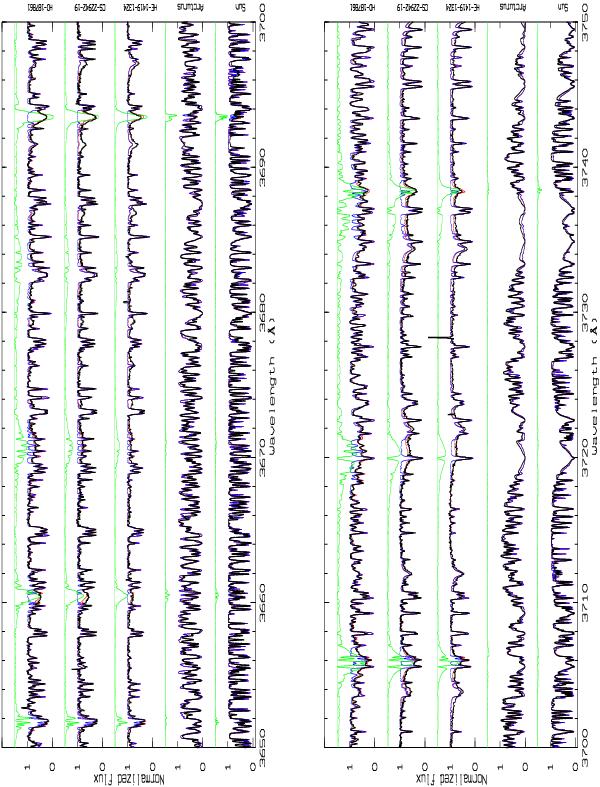
Atlas of predissociation lines for a sample of stars. The black line shows the observations while the red lines shows the synthetic fit with all atomic and molecular lines included, the blue line shows the synthetic fit without CH predissociation lines and the green line shows the contribution of the CH predissociation lines alone. We note that the continuum has been arbitrarily placed at 1.5 for the synthetic fit. See Table A.1 for a list of the basic properties of the displayed stars.
Current usage metrics show cumulative count of Article Views (full-text article views including HTML views, PDF and ePub downloads, according to the available data) and Abstracts Views on Vision4Press platform.
Data correspond to usage on the plateform after 2015. The current usage metrics is available 48-96 hours after online publication and is updated daily on week days.
Initial download of the metrics may take a while.