Fig. A.2
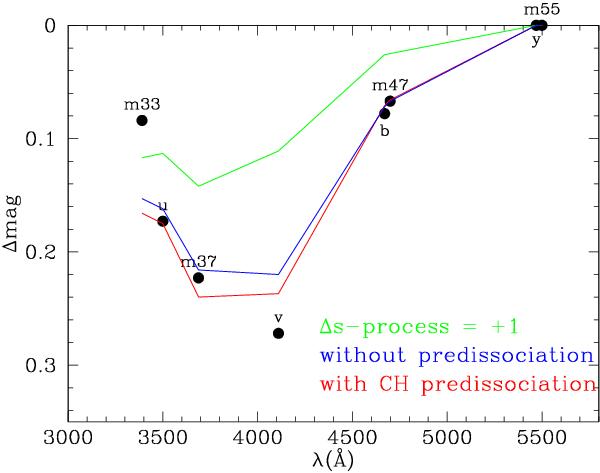
Drop in magnitudes in the blue-yellow spectra of the barium star ζ Cap compared to the normal giant o Uma due to blanketing by heavy elements and by CH and CN. The black dots correspond to different photometric bands, as taken from Bond & Neff (1969), and the continuous lines correspond to the synthetic spectra with s-process elements increased by +1 dex (green line) and with CH added with (red line) or without (blue line) predissociation lines. While similar atmospheric parameters were used, carbon and s-process element overabundances of 0.5 dex and 1 dex were adopted, respectively.
Current usage metrics show cumulative count of Article Views (full-text article views including HTML views, PDF and ePub downloads, according to the available data) and Abstracts Views on Vision4Press platform.
Data correspond to usage on the plateform after 2015. The current usage metrics is available 48-96 hours after online publication and is updated daily on week days.
Initial download of the metrics may take a while.