Fig. 2
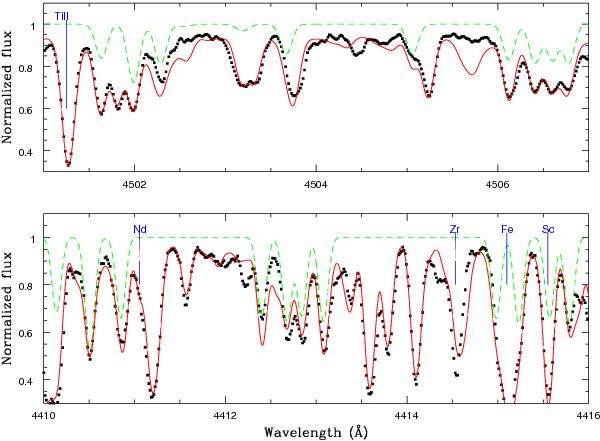
Example of stellar spectrum syntheses in the CH A−X transition region. The stellar spectrum is plotted with black points, the red continuous line is the synthesis including both atomic and molecular lines, and the green dashed line is the synthesis with only CH A−X 5−5 transitions in HE 2201-0345 (upper panel) and CH A−X 4−4 transitions in CS 22942-019 (lower panel) identified for the first time in a spectrum. We note that some of the mismatches between the synthesis and the observation (e.g. 4505.7 Å, 4412 Å) can be attributed to inaccuracies of other atomic or molecular linelists.
Current usage metrics show cumulative count of Article Views (full-text article views including HTML views, PDF and ePub downloads, according to the available data) and Abstracts Views on Vision4Press platform.
Data correspond to usage on the plateform after 2015. The current usage metrics is available 48-96 hours after online publication and is updated daily on week days.
Initial download of the metrics may take a while.