Fig. 1
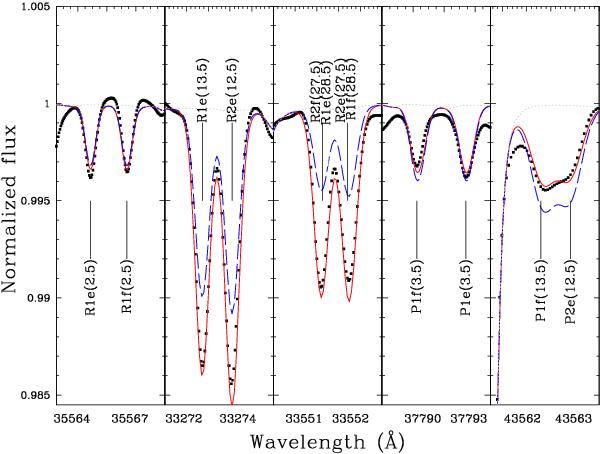
Synthetic spectrum of the Sun near the 1−0 ro-vibrational band of CH compared to the observed solar spectrum (ACE; Bernath et al. 2005; dotted line). The red line includes the J-dependence correction (see text) while the blue does not. The first 3 panels from left to right show from the R branch, for which intensity increases with increasing J. The increasing relative strength between the synthesis with and without the J-dependence correction demonstrates the rotational dependence of the transition moment for CH. The two right panels show lines from the P branch. The fact that the J-dependence correction is not the same as for R branches is due to the Herman-Wallis effect.
Current usage metrics show cumulative count of Article Views (full-text article views including HTML views, PDF and ePub downloads, according to the available data) and Abstracts Views on Vision4Press platform.
Data correspond to usage on the plateform after 2015. The current usage metrics is available 48-96 hours after online publication and is updated daily on week days.
Initial download of the metrics may take a while.