Fig. 4
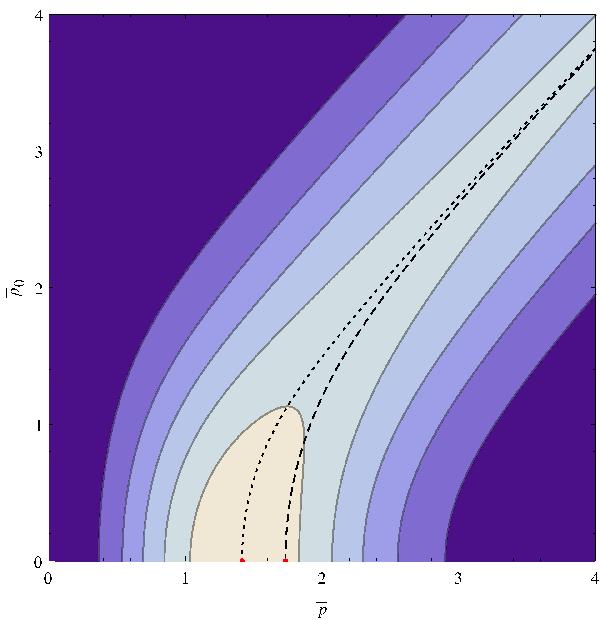
Contour plot of the angular-marginalized ![]() -distribution given by Eq. (24). The contours are at 0.1 intervals with the lighter shades corresponding to larger values. The dotted and dashed curves (Eqs. (25) and (26)) trace maximums along horizontal and vertical slices and end at the red points at
-distribution given by Eq. (24). The contours are at 0.1 intervals with the lighter shades corresponding to larger values. The dotted and dashed curves (Eqs. (25) and (26)) trace maximums along horizontal and vertical slices and end at the red points at ![]() and
and ![]() , respectively. Although the “shape” of the distribution is not affected by the value of σ, the plot assumes that σ ≤ 1/4 so that the plotted values for
, respectively. Although the “shape” of the distribution is not affected by the value of σ, the plot assumes that σ ≤ 1/4 so that the plotted values for ![]() up to 4 (=1 /σmax) exist.
up to 4 (=1 /σmax) exist.
Current usage metrics show cumulative count of Article Views (full-text article views including HTML views, PDF and ePub downloads, according to the available data) and Abstracts Views on Vision4Press platform.
Data correspond to usage on the plateform after 2015. The current usage metrics is available 48-96 hours after online publication and is updated daily on week days.
Initial download of the metrics may take a while.