Fig. 7
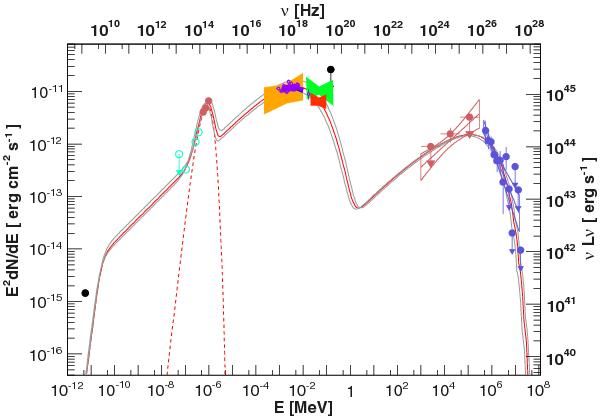
Spectral energy distribution of HESS J1943+213. Empty blue circles are the WISE data and the red circles the CAHA results. The red butterfly is the Fermi-LAT best-fit power law and the 68% error contour. A 2σ upper limit is reported for the LAT data points if TS < 9. Other data were extracted from Abramowski et al. (2011): the black point is the NVSS measurement, the yellow, blue, and red butterflies are respectively the Chandra, Swift-XRT, and INTEGRAL-IBIS measurements. The green point is from the 70-month Swift-BAT catalogue (Baumgartner et al. 2013). The upper limit is from INTEGRAL-SPI. The purple points are the Suzaku measurements extracted from Tanaka et al. (2014). The red line is the result of the SSC calculation for z = 0.2, and the grey lines were obtained for z = 0.03 and z = 0.45.
Current usage metrics show cumulative count of Article Views (full-text article views including HTML views, PDF and ePub downloads, according to the available data) and Abstracts Views on Vision4Press platform.
Data correspond to usage on the plateform after 2015. The current usage metrics is available 48-96 hours after online publication and is updated daily on week days.
Initial download of the metrics may take a while.