Fig. 6
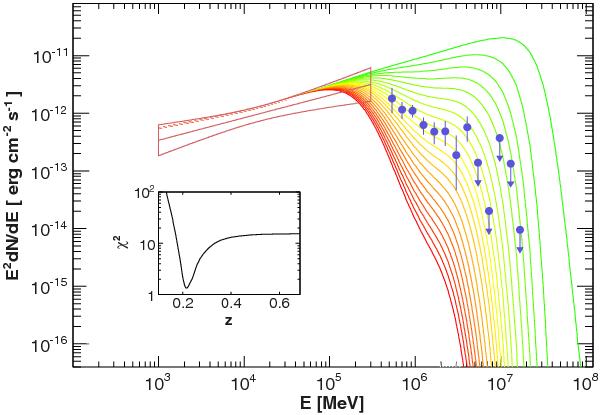
Spectral energy distribution of HESS J1943+213 in γ-rays. The Fermi-LAT error contour (red) has been extrapolated toward the H.E.S.S. energy range (blue points) and corrected for EBL absorption using the model of Franceschini et al. (2008) assuming different values for z from z = 0.01 (green line) to z = 0.7 (red line). The inset gives the corresponding χ2 as a function of the redshift z.
Current usage metrics show cumulative count of Article Views (full-text article views including HTML views, PDF and ePub downloads, according to the available data) and Abstracts Views on Vision4Press platform.
Data correspond to usage on the plateform after 2015. The current usage metrics is available 48-96 hours after online publication and is updated daily on week days.
Initial download of the metrics may take a while.