Fig. 3
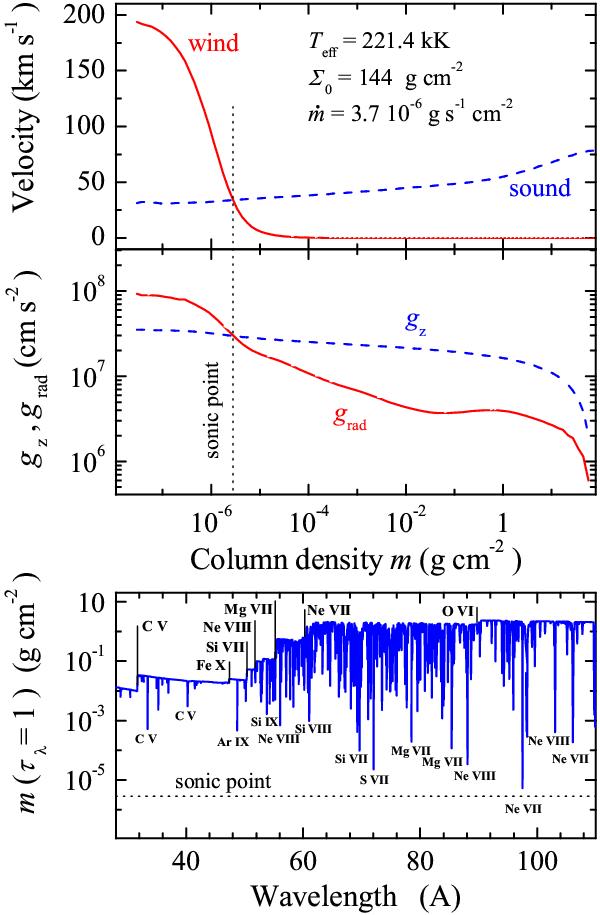
Top panel: sound speed (dashed curve) and wind velocity (solid curve) distributions along depth in the ring model shown in Fig. 2. Middle panel: distributions of gravity (dashed curve) and radiative acceleration (solid curve) along depth. The position of the sonic point is marked by the dotted vertical line. Bottom panel: depths where the emergent spectrum forms (τλ = 1). The position of the sonic point is marked by the dashed horizontal line.
Current usage metrics show cumulative count of Article Views (full-text article views including HTML views, PDF and ePub downloads, according to the available data) and Abstracts Views on Vision4Press platform.
Data correspond to usage on the plateform after 2015. The current usage metrics is available 48-96 hours after online publication and is updated daily on week days.
Initial download of the metrics may take a while.