Fig. 2
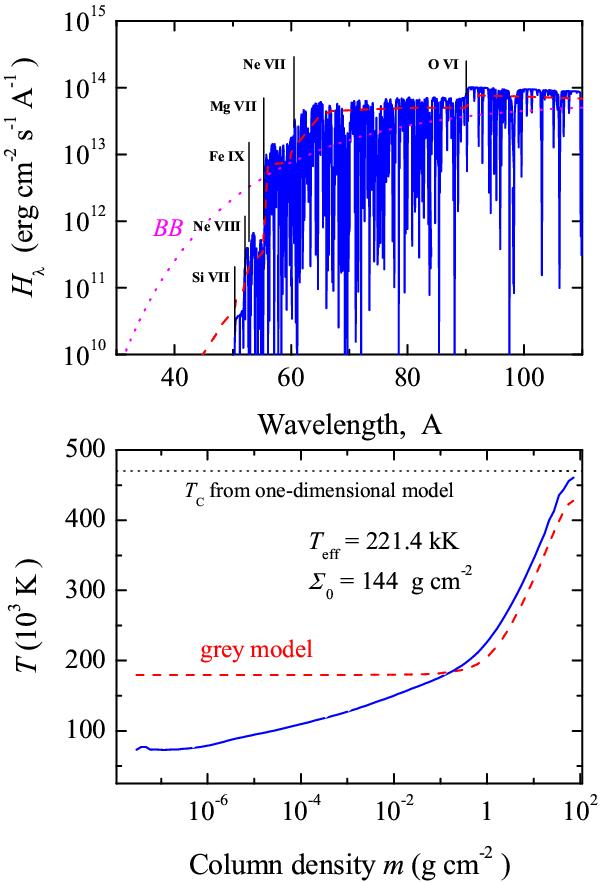
Top panel: local spectra of the hottest ring of the same BL model as in Fig. 1 computed with (solid curve) and without (dashed curve) spectral lines taken into account. The blackbody spectrum corresponding to the effective temperature is shown by the dotted curve. Bottom panel: temperature structures of the model with lines (solid curve) and the gray model (dashed curve). The central temperature of the hydrodynamical 1D model is shown by the dotted line.
Current usage metrics show cumulative count of Article Views (full-text article views including HTML views, PDF and ePub downloads, according to the available data) and Abstracts Views on Vision4Press platform.
Data correspond to usage on the plateform after 2015. The current usage metrics is available 48-96 hours after online publication and is updated daily on week days.
Initial download of the metrics may take a while.