Fig. 11
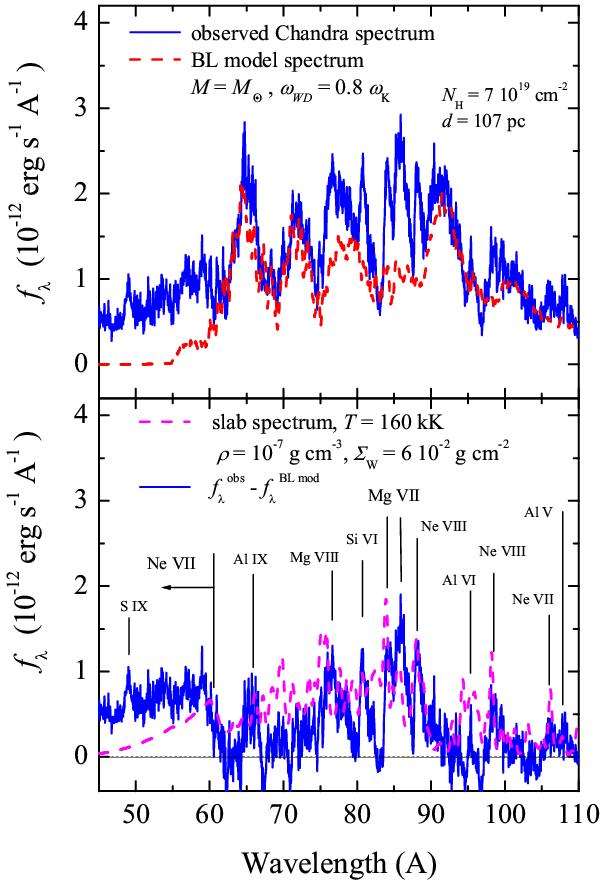
Top panel: comparison of the observed SS Cyg soft X-ray spectrum (solid curve) with the BL model spectrum for a 1 M⊙ WD and relative angular velocity ωWD = 0.8 ωK (dashed curve). Bottom panel: subtracted (observed minus BL model) spectrum (solid curve) together with the homogeneous slab model spectrum (dashed curve). The emission continuum of Ne VII below 60 Å and the strongest identified emission lines are marked.
Current usage metrics show cumulative count of Article Views (full-text article views including HTML views, PDF and ePub downloads, according to the available data) and Abstracts Views on Vision4Press platform.
Data correspond to usage on the plateform after 2015. The current usage metrics is available 48-96 hours after online publication and is updated daily on week days.
Initial download of the metrics may take a while.