Fig. 1
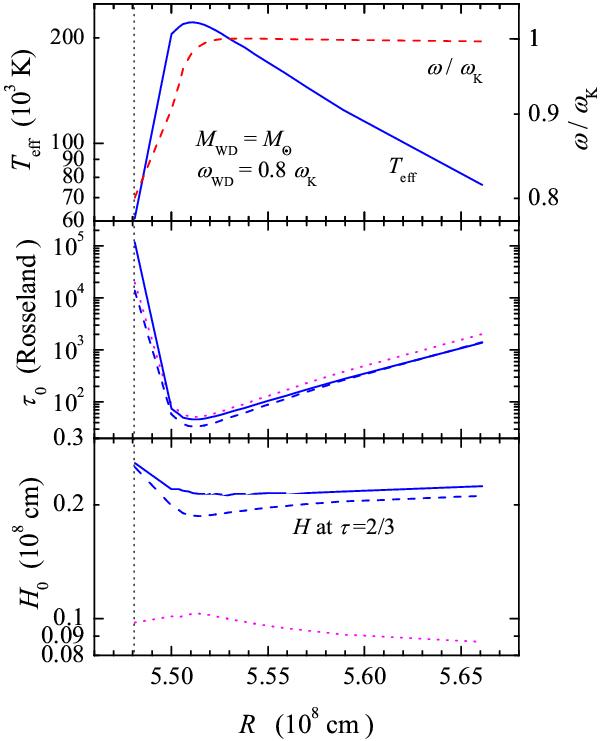
Distribution of BL quantities along radius. The data are from the model with MWD = M⊙ and ωWD = 0.8 ωK. The position of the WD surface at RWD = 5.48 × 108 cm is shown by the vertical dotted line. Top panel: shown is the effective temperature (solid curve) together with the relative angular velocity (dashed curve), as obtained from the 1D hydrodynamical model. These are the same for the atmosphere models. Middle and bottom panels: Rosseland optical half-thickness, τ0, and geometrical half-thickness, H0, for the model-atmosphere models (solid lines). The distributions obtained from the 1D hydrodynamical model (dotted curves) and the gray model (dashed curves) are also shown.
Current usage metrics show cumulative count of Article Views (full-text article views including HTML views, PDF and ePub downloads, according to the available data) and Abstracts Views on Vision4Press platform.
Data correspond to usage on the plateform after 2015. The current usage metrics is available 48-96 hours after online publication and is updated daily on week days.
Initial download of the metrics may take a while.